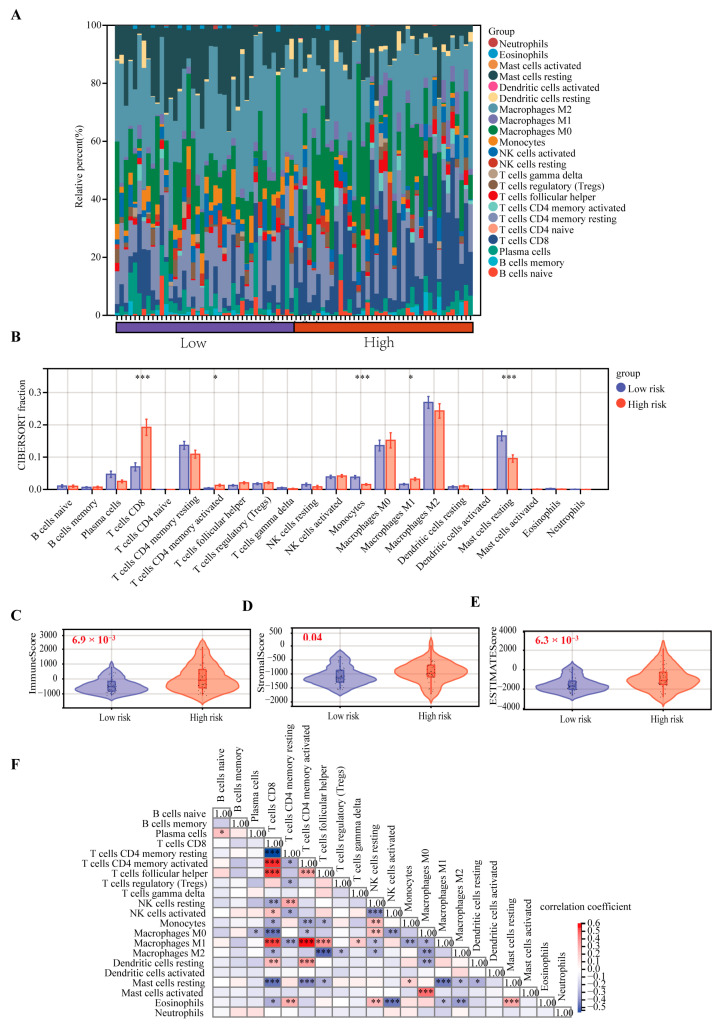
Figure 7.
Comparison of the 22 TICs between the low-risk and high-risk groups. (A) Heatmap of the 22 TICs in all the patients. (B) Comparing the proportions of the 22 TICs between the low-risk and high-risk groups. (C–E) Comparison of the immune, stromal, and estimate scores. (F) Heatmap of the correlation of the immune cells. * p < 0.05, ** p < 0.01, and *** p < 0.001.

