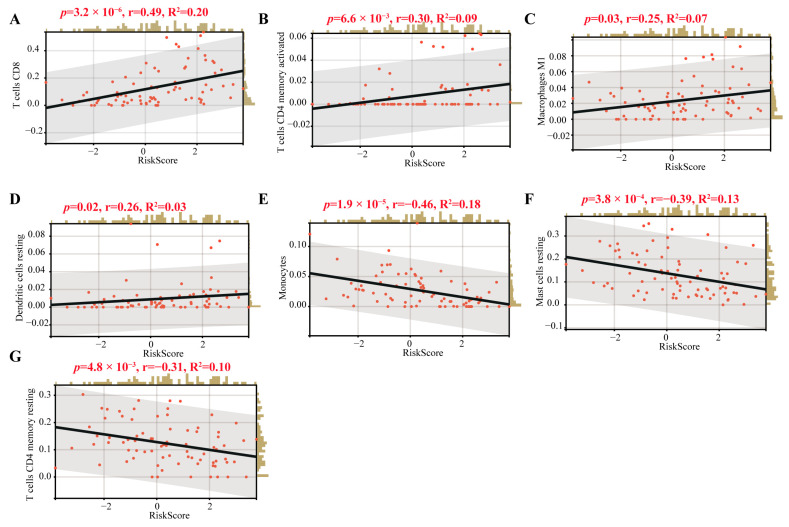
Figure 8.
Correlations of the TICs and the CRTG signature. (A–G): The black line in each graph fits a linear model that indicates the proportional trend of the TICs and the risk score. The grey shading around the black line indicates the 95% confidence interval. The brown columns and red dots represent UM cases.

