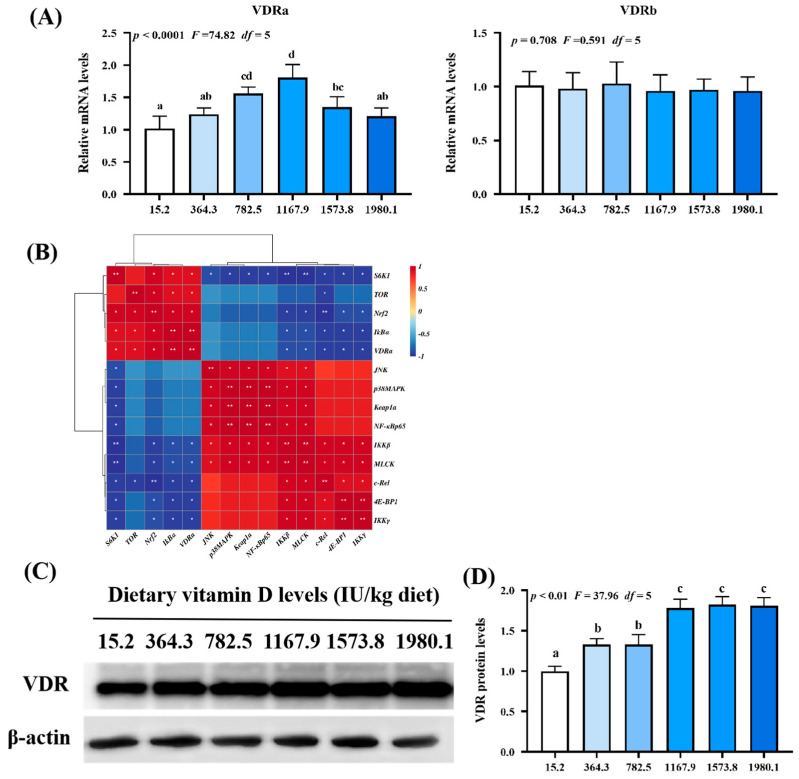
Figure 8.
Relative mRNA levels (A), correlation analysis (B), protein levels (C) and analysis result (D) of VDR in the skin of on−growing grass carp (Ctenopharyngodon idella) administered vitamin D after infection with A. hydrophila. VDR, vitamin D receptor; N = 6 for gene expression and N = 3 for western blotting analysis; error bars indicate SD. Values with different letters are significantly different (p < 0.05); red indicates upregulation; blue indicates downregulation; * presents p < 0.05, ** presents p < 0.01.

