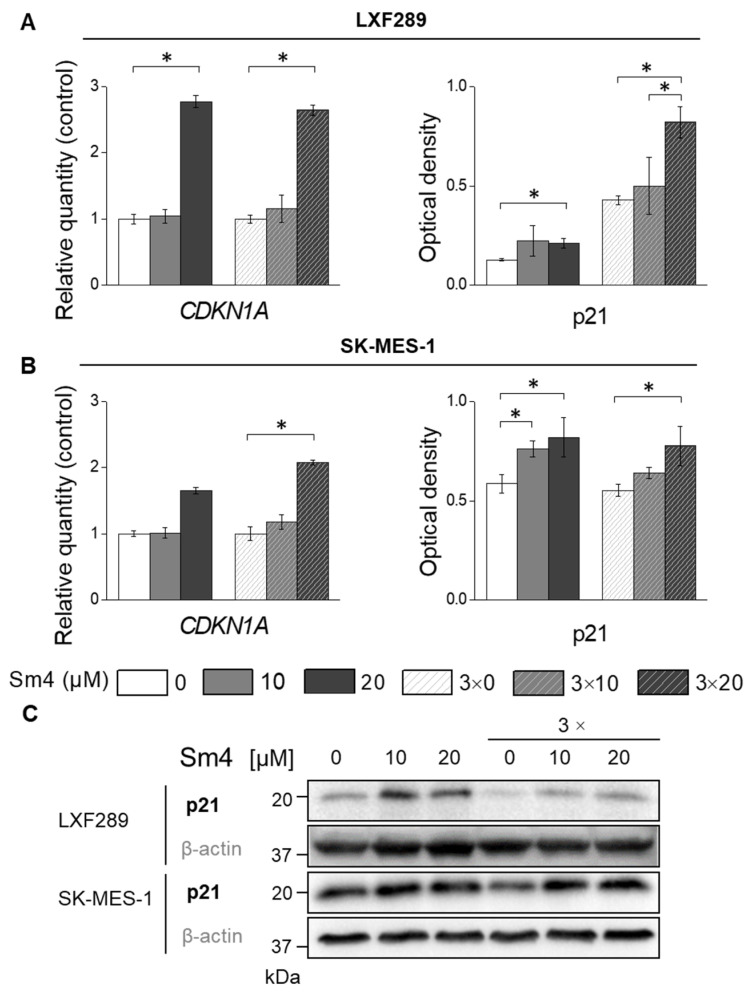
Figure 5.
Gene expression analysis by qPCR of CDKN1A and protein levels by Western blot of p21 in LXF-289 (A) and SK-MES-1 cell lines (B). Western blot for p21 and β-actin in LXF-289 and SK-MES-1 cell lines for one- and three-time Sm4 treatment (C). The statistical analysis of protein expression changes was based on densitometry results obtained from three independent experiments and two technical repetitions (n = 6). The asterisk indicates p < 0.05.

