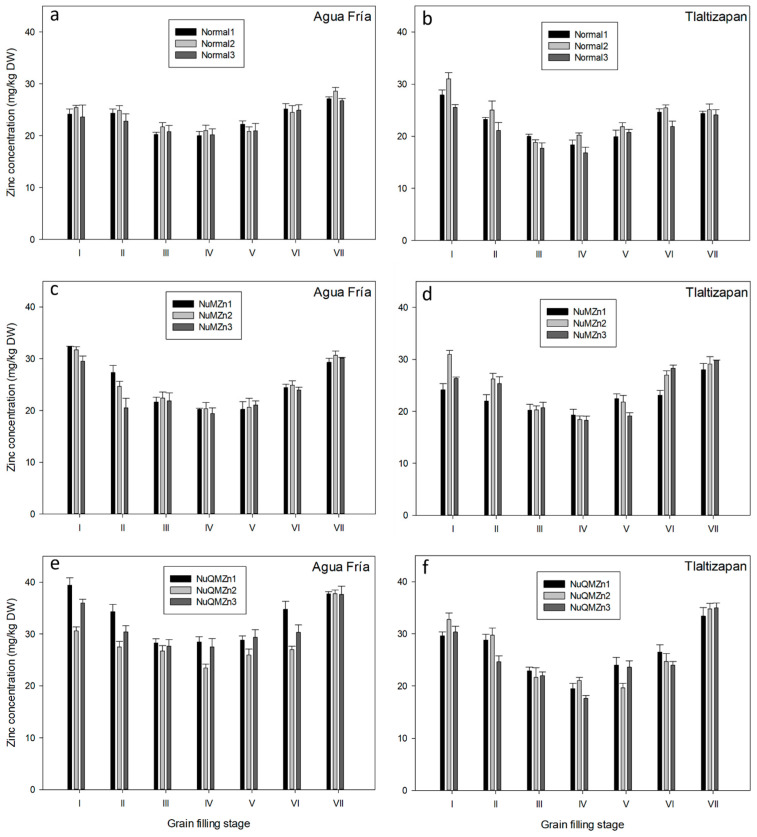
Figure 1.
Zinc content during different grain filling stages. Lower case letters indicate Tukey grouping (p < 0.05) among types of genotypes (Normal, High Zn, and HighZn + QPM) at different locations (AF and TL). Normal genotypes: graphs (a,b). High Zn genotypes: graph (c,d). HighZn + QPM genotypes: graphs (e,f). The bars indicate the standard deviation of 10 to 12 determinations by genotype type.

