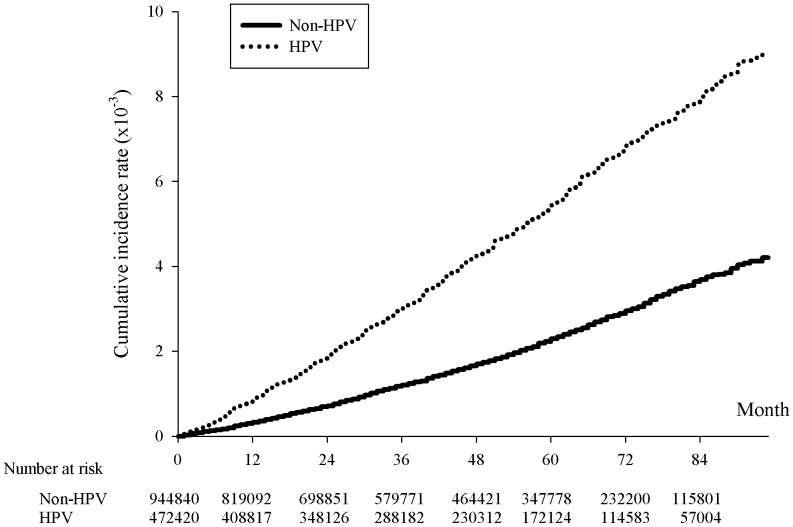
Figure 1.
Kaplan-Meier curve of the cumulative incidence rates of breast cancer with and without HPV infection. The x-axis represents month since the index date, supplemented with the number of HPV cases and twice the non-HPV cases collected within each span of twelve months, p<.0001. The y-axis indicated the incidence rates in 10-3.

