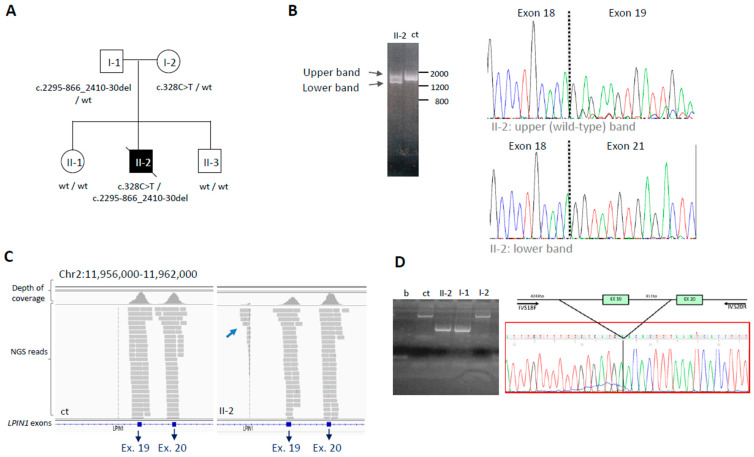
Figure 3.
Deep DNA and RNA analysis of the subject with LPIN1 variants. (A) Pedigree of the patient 6/C (II-2), carrying two variants in LPIN1, and segregation analysis in the family. (B) Amplification of the LPIN1 transcript, which highlights two bands in the proband II-1, while control DNA (ct) has a single band. Sanger electropherograms show that the upper band corresponds to the wild-type transcript, and the lower one corresponds to a transcript missing exons 19–20. (C) Snapshots from Integrative Genomic Visualization showing NGS analysis of the genomic region containing LPIN1 exons 19–20. The lower coverage of exon 19 in II-2 compared to control (ct) is due to a heterozygous exon deletion; in II-2, some reads (arrow) map to the region upstream of the deletion. (D) Genomic DNA analysis by PCR using specific primers to define the deletion breakpoints (b = blank sample, ct = control sample, II-2 patient 6/C, I-1: father; I-2: mother). Sanger sequencing of the amplicon containing the deletion reveals it is c.2295–866_2410-30del.

