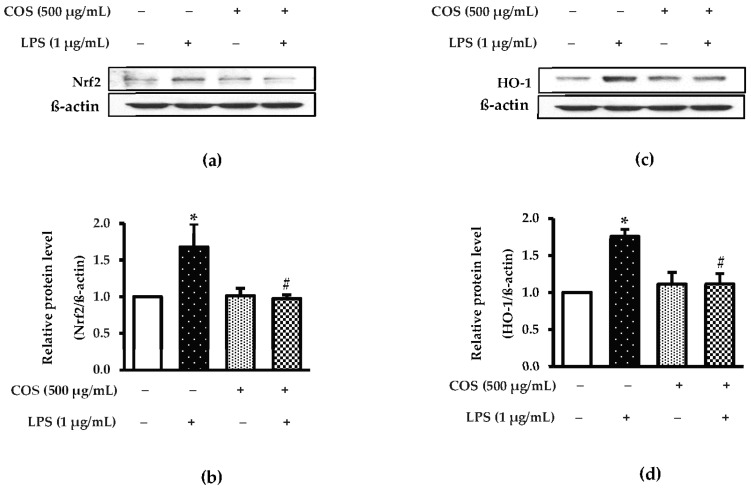
Figure 6.
COS diminished LPS-activated Nrf2/HO-1 in RAW264.7 cells. The cells were preincubated with 500 μg/mL COS for 24 h, followed by 1 μg/mL LPS for 24 h. The expression level of Nrf2/HO-1 was investigated using western blot analysis. (a) Expression of Nrf2. (b) Quantification of Nrf2. (c) Expression of HO-1. (d) Quantification of HO-1. The signal intensity was normalized to the corresponding intensity of β-actin. Results are shown as the mean ± SD (n = 4). * p < 0.05 vs. control cells. # p < 0.05 vs. the LPS group.

