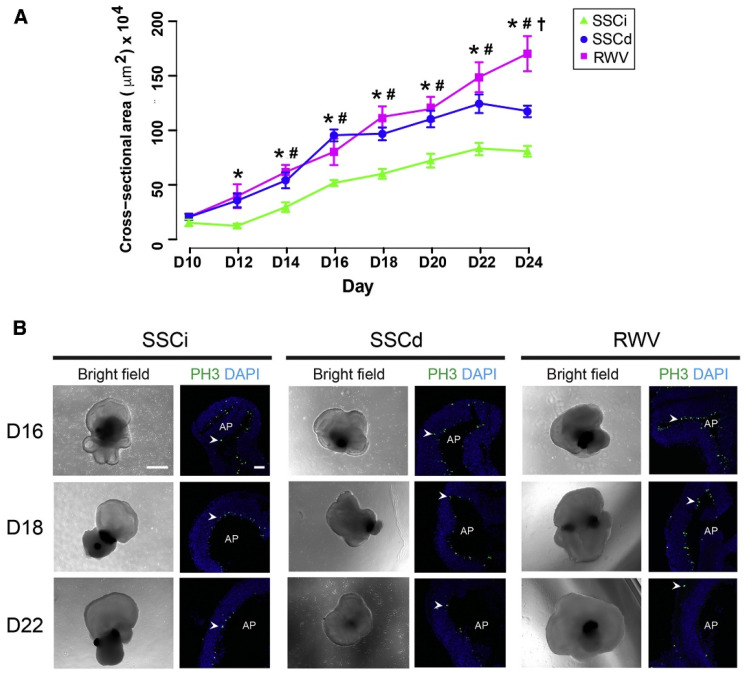
Figure 5.
Growth of Organoids Under Different Culturing Conditions. (A) Neural retina growth curves throughout differentiation. The largest cross-sectional area of each organoid (in μm2) was measured every other day of differentiation. SSCi, intact organoids in static suspension culture; SSCd, dissected neural retina in static suspension culture; RWV, dissected neural retina in rotating-wall vessel bioreactors. The data were obtained from three independent biological experiments (n = 3; three organoids were quantified in each experiment) and are represented as mean ± SEM. ∗ p < 0.05 for SSCi versus RWV; # p < 0.05 for SSCi versus SSCd; † p < 0.05 for SSCd versus RWV. (B) Morphology of neural retina (NR) with dividing cells. Phospho-histone H3 (PH3, green) is a marker of proliferating cells. Nuclei were stained with DAPI (blue). Shown are representative figures. Arrowheads indicate relevant immunostaining with PH3. AP shows the apical side of the organoids. Scale bars: 500 μm (left) and 50 μm (right). Reproduced with permission from Distefano et al. (2018) [65].

