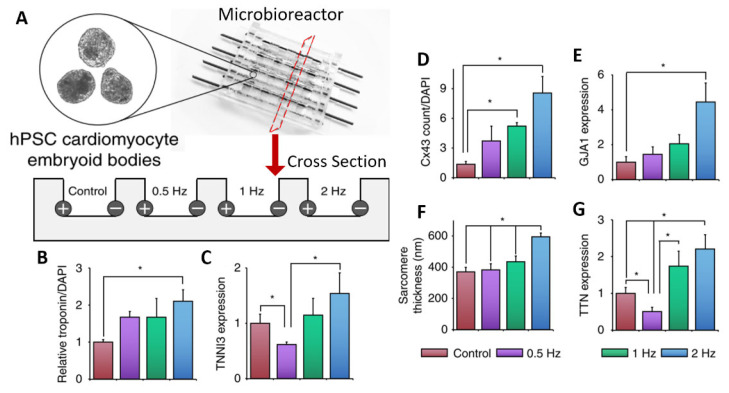
Figure 8.
PDMS microbioreactor for electrical stimulation. (A) Schematic of microbioreactor set-up showing carbon rod electrodes embedded in PDMS. A cross-sectional view shows electrodes at the edges of PDMS wells with room for organoids in the center. Cells were subject to ES for 7 days at specified frequencies. (B–G) Quantification of various markers for cardiac differentiation and maturation measured by immunostaining for Troponin T (B), Connexin43 (D), sarcomere count (F), qPCR for Troponin I (C), Gap Junction Protein Alpha 1 (E), or Titin (G). All error bars show the standard error of the mean (SEM), * p < 0.05. Adapted with permission from Eng et al. [85].

