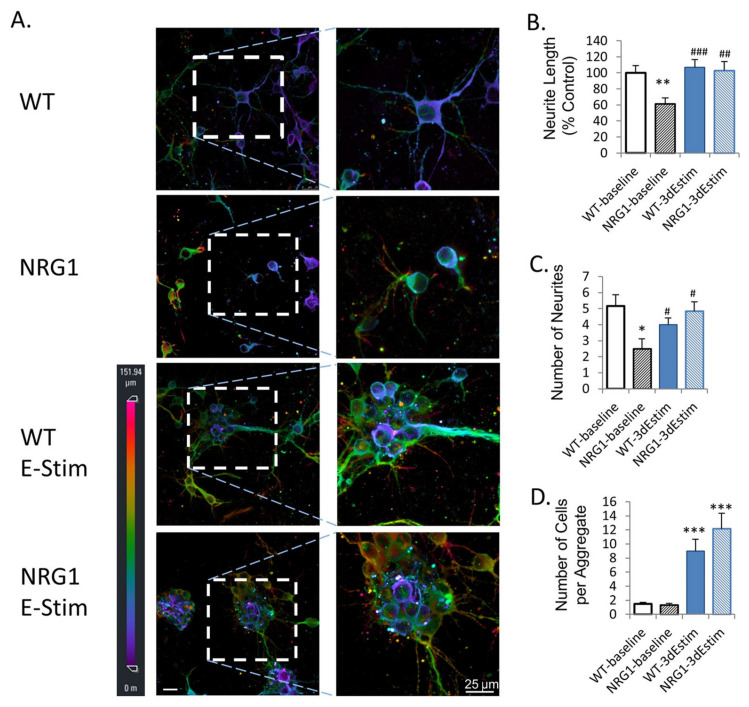
Figure 9.
Effects of ES on primary neural organoids. (A) MAP2 immunofluorescence imaged using 3D confocal imaging. Conditions are WT (wild type), NRG1 (neuregulin 1 knock-out), WT ES, and NRG1 with ES. All cells are primary mouse prefrontal cortex neurons. (B) Quantified neurite length. (C) Number of neurons. (D) Number of cells per aggregate. * p < 0.05 vs. wild-type, baseline; ** p < 0.01 vs. wild-type, baseline; *** p < 0.001 vs. wild-type, baseline; # p < 0.05 vs. NRG1-KO, baseline; ## p < 0.01 vs. NRG1-KO, baseline; ### p < 0.001 vs. NRG1-KO, baseline. Error bars indicate SEM. Reproduced with permission from Zhang et al. [89].

