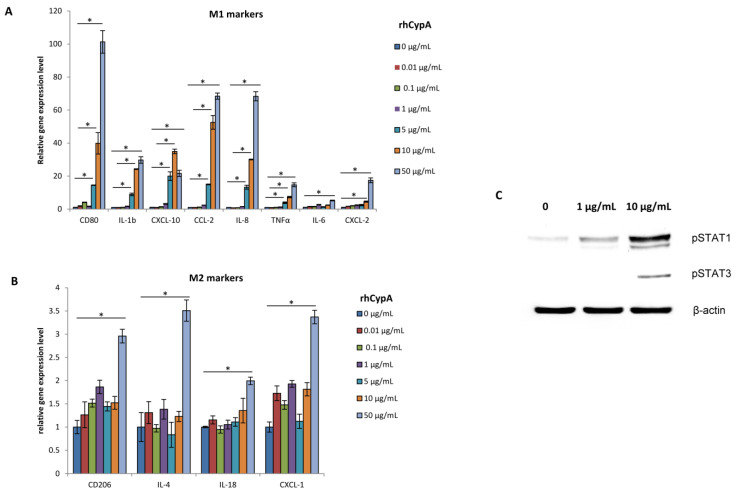
Figure 5.
Effects of rhCypA on macrophage M1/M2 polarization. THP-1 cells were cultured with rhCypA at the indicated concentrations for 24 h. Relative gene expression levels of M1 (A) and M2 (B) markers were evaluated by qPCR. The data of one representative experiment is presented as mean ± SD for three technical repeats. (C) Expression levels of phosphorylated STAT1 and STAT3 were analyzed by Western blot. * p < 0.01 (Mann–Whitney U-test).

