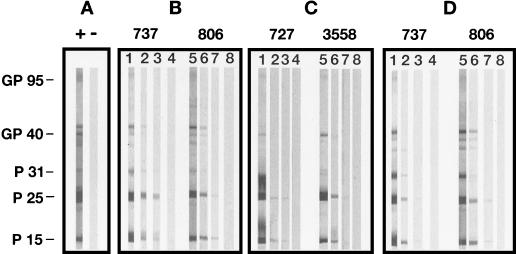
FIG. 2.
Quantitative WB analysis of representative sera from vaccinated cats and control cats. (A) One infected (+) and one negative (−) control serum, each diluted 1:100. (B to D) Two sera each from group 1, group 2, and group 3 sera from vaccinated cats, respectively. Serum dilutions shown are as follows. (B) Lane 1, 1:100; lane 2, 1:2,000; lane 3, 1:32,000; lane 4, 1:50,000; lane 5, 1:100; lane 6, 1:2,000; lane 7, 1:64,000; lane 8, 1:80,000. (C) Lane 1, 1:100; lane 2, 1:2,000; lane 3, 1:200,000; lane 4, 1:400,000; lane 5, 1:100; lane 6, 1:1,000; lane 7, 1:400,000; lane 8, 1:600,000. (D) Lane 1, 1:100; lane 2, 1:26,400; lane 3, 1:102,400; lane 4, 1:140,000; lane 5, 1:100; lane 6, 1:3,200; lane 7, 1:640,000; lane 8, 1:800,000.

