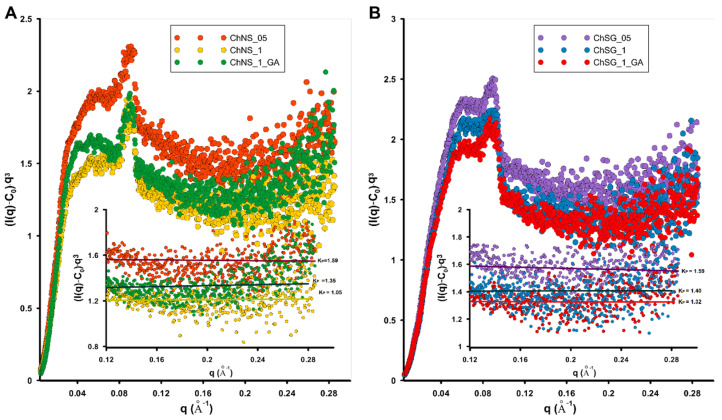
Figure 2.
Porod plots with slit collimation calculated for the investigated silica–biopolymer composites ChNS_05, ChNS_1 and ChNS_1_GA (A) and ChSG_05, ChSG_1 and ChSG_1_GA (B). The asymptotic range of each curve was approximated using a linear function, and a specific Porod constant was indicated for each function.

