Figure 1.
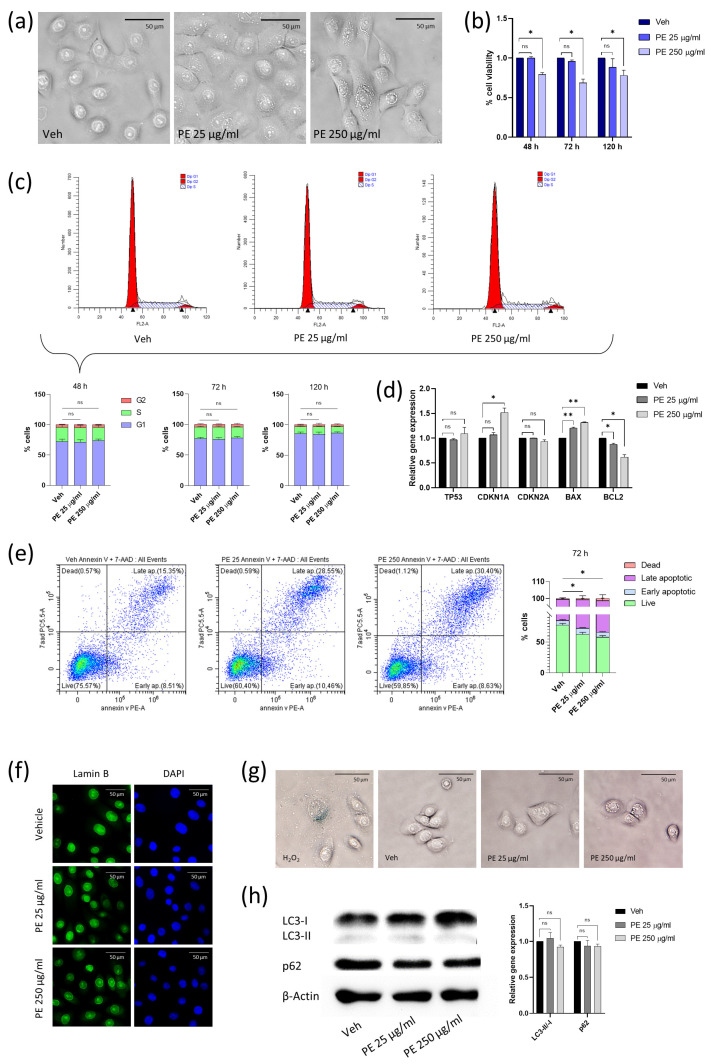
Evaluation of vaginal keratinocyte morphology and viability after acute PE N/MPL exposure. (a) Representative images of VK2 E6/E7 treated for 48 h with Tween20 (Veh; 0.0025%) or PE N/MPLs at low and high concentrations (25 and 250 μg/mL). Pictures were taken at 40× magnification. Scale bars are 50 μm. (b) Graphical representation of the percentage of viable vaginal keratinocytes after 48, 72, and 120 h vehicle or PE N/MPL exposure obtained with a Trypan blue dye exclusion assay. (c) Representative plots of FACS cell cycle analysis at 48 h and percentage histograms at 48, 72, and 120 h exposure to vehicle or PE N/MPLs. Arrowheads in FACS plots indicate the ideal position of G1 and G2 peaks. (d) Histograms showing gene expression levels of cell cycle and apoptosis markers in cells treated for 48 h with PE N/MPLs compared to vehicle. (e) Representative dot plots and histograms displaying the percentage of apoptotic cells upon vehicle and PE particle exposure for 72 h. Blue corresponds to areas of lower cell density, red and orange are areas of high cell density, green and yellow indicate mid-range density areas. (f) Illustrative IF pictures for Lamin B (green, left) and DAPI (blue, right) staining of VK2 E6/E7 treated with vehicle or PE N/MPLs 25–250 μg/mL for 72 h. Pictures were taken at 40× magnification. Scale bars are 50 μm. (g) Representative pictures of β-galactosidase staining of VK2 E6/E7 exposed to vehicle or PE 25 and 250 μg/mL for 72 h. H2O2 treatment was used as a positive control. Pictures were taken at 40× magnification. Scale bars are 50 μm. (h) Illustrative Western blot and densitometric analysis for the autophagy markers LC3 B and p62 in VK2 E6/E7 exposed to vehicle or PE 25 and 250 μg/mL for 48 h (β-Actin was used as loading control) (Figure S2). For all the experiments, statistical analysis was conducted by unpaired, two-tailed Student’s t-test (n > 3) with “ns” non-significant, * p ≤ 0.05 and ** p ≤ 0.005.

