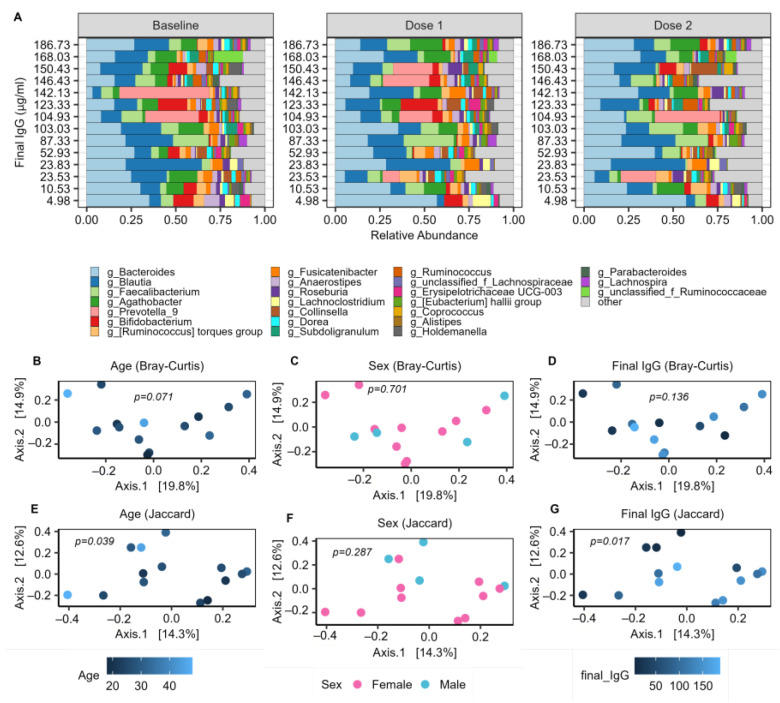
Figure 3.
Summary of microbiome profiles. (A). Relative abundance of the top 25 genera across the 3 sampling timepoints; (B–G) PCoA plots of baseline microbiomes with colors to indicate subjects of varying age, sex, and final IgG level. PERMANOVA identified a significant relationship between the baseline microbiome and age (p = 0.039), as well as between the baseline microbiome and IgG response post-dose 2 (p = 0.017) with the Jaccard distance metric. All 16 subjects were included for analysis of relative abundance, age, and sex. IgG analysis included the 14 subjects from whom final IgG titers were obtained.

