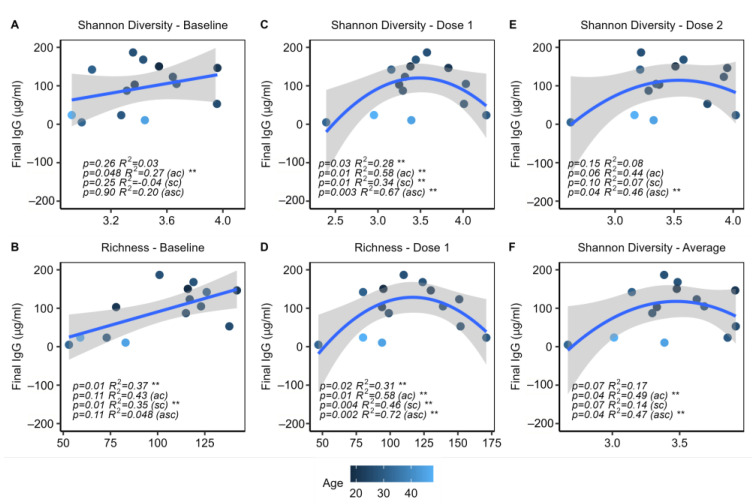
Figure 4.
Diversity and richness are associated with IgG response. n = 14, including all subjects with final IgG titers. Linear and quadratic regressions with and without controlling age (ac), sex (sc), or age and sex (asc) as covariates. (A,B) Shannon diversity and richness at baseline (BL) showed positive linear correlations with the final IgG level. (C,D) Shannon diversity and richness after dose 1 showed significant quadratic relationships with the final IgG level. (E) Shannon diversity at dose 2 was also quadratically associated with the final IgG level. (F) The average Shannon diversity of each subject across all 3 timepoints showed a significant quadratic relationship with the final IgG. ** indicates p < 0.05.

