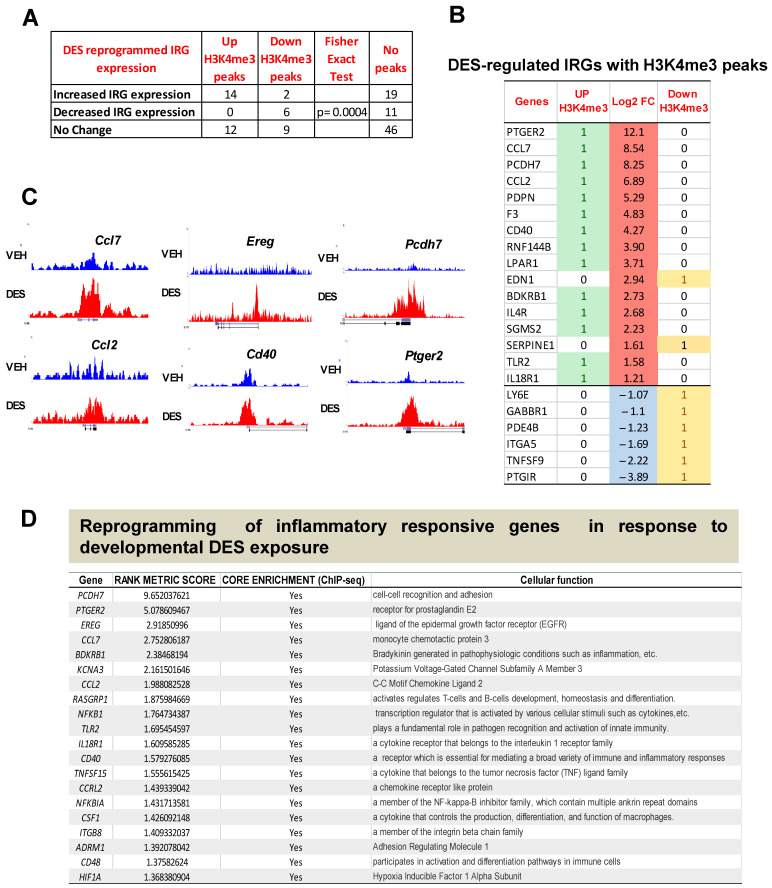
Figure 2.
The correlation between RNA expression and H3K4me3-reprogrammed genes. DES-MMSCs and VEH-MMSCs were isolated and subjected to immunoprecipitation with anti-H3K4me3 antibody. ChIP-seq and bioinformatic analysis were performed as described in the Materials and Methods Section. (A) DES-regulated IRGs with enrichment or reduction of H3K4me3. (B) The list of IRGs with H3K4me3 status. Up-DEGs were highlighted in red. Down-DEGs were highlighted in light blue color. Up-H3K4me3 were highlighted in green color. (C) Histograms created using Integrative Genomics Viewer showing H3K4me3 occupancy at Ccl7, Ccl2, Ereg, Cd40, Pcdh7, and Ptger2. For each gene, the upper and lower browser images display an expanded view of a selected region of the H3K4me3 peak distributions in VEH-MMSCs (blue track) and DES-MMSCs (red track). (D) The list of top 20 reprogrammed IRGs showing their cellular functions.

