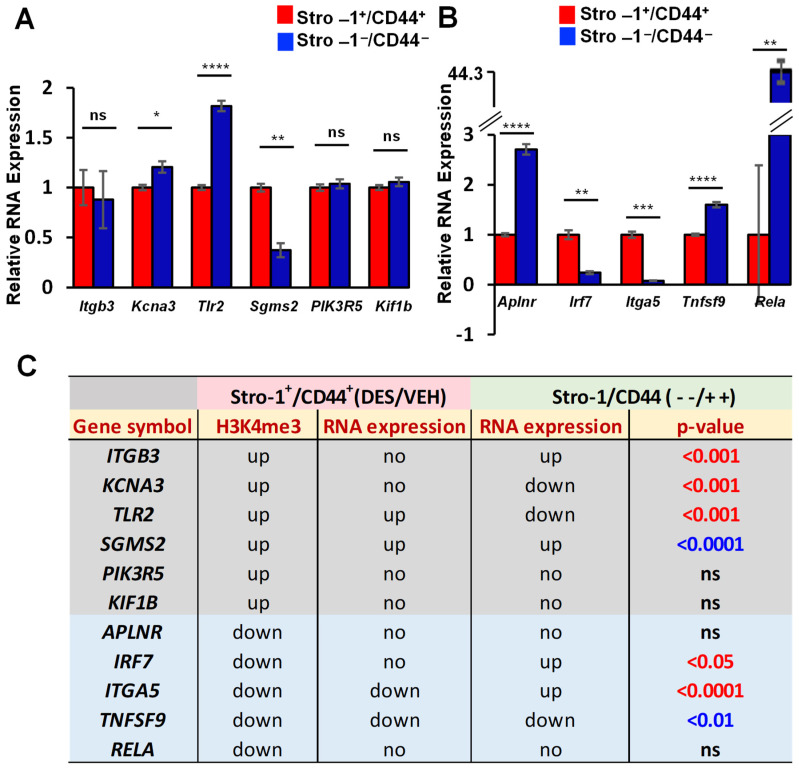
Figure 4.
Specific reprogramming of IRGs in MMSCs. (A) Bar plots showing the differential expression of IRGs, including Itgb3, Kcna3, Tlr2, Sgms2, Pik3R5, and Kif1b, between DES-MMSCs and DES-DMCs. (B) Bar plots showing the differential expression of IRGs, including Aplnr, Lrf7, Itga5, Tnfsf9, and Rela, between DES-MMSCs and DES-DMCs. (C) The correlation between H3K4me3 status and the expression of reprogrammed IRGs (the expression comparison between DES-MMSCs and DES-DMCs, or expression comparison between DES-MMSCs vs VEH-MMSCs). ns: no significant difference. The genes with a grey color background are H3K4me3-enriched genes. The genes with the reduced H3K4me3 are presented with a light blue background. The p-value shows the significant difference in gene expression between Stro-1/CD44 double-positive and double-negative cells. Additionally, the p-values with the blue color show two comparisons of gene expression (Stro-1/CD44 double-positive vs. double-negative cells, or Stro-1+/CD44+ DES vs. VEH) going in the same direction. The p-values with the red color indicated that two comparisons go in the opposite direction, or one comparison shows either up- or down-regulated, and the other shows no significant changes at all. * p < 0.05; ** p < 0.01, *** p < 0.001, **** p < 0.0001. ns: no significant difference. no: no significant changes.

