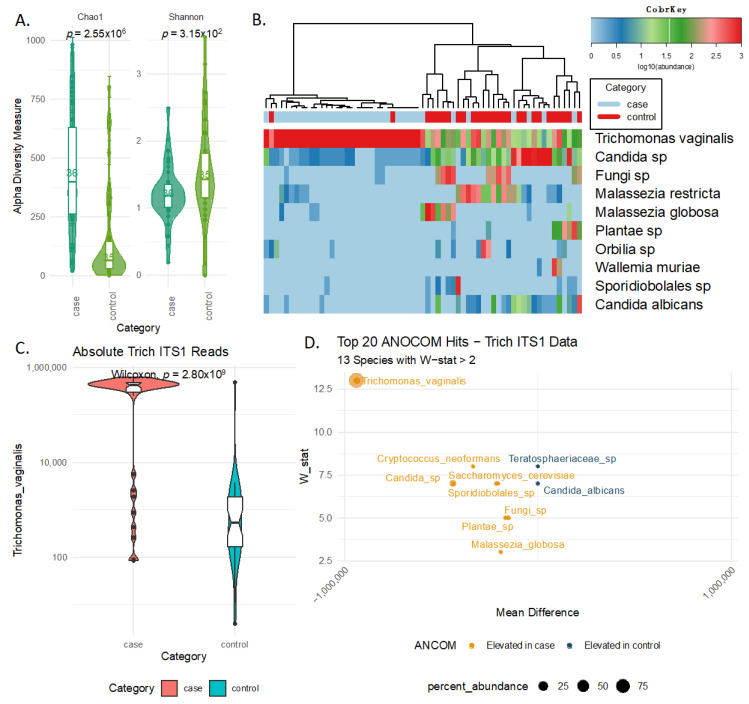
Figure 1.
ITS1-Derived Eukaryotic Community is Fundamentally Altered in TV Cases. Panel (A) shows the ITS1 alpha diversity with respect to Chao1, which is a measure of richness (i.e., how many different species are detected) and Shannon diversity, which is a measure of evenness (i.e., how uniformly the sequencing reads are spread across the different sequence variants). p-values in the panel are based on t-test. Panel (B) shows a heatmap of the top 10 species detected using ITS1, with the top strip showing the TV case status (red for controls and blue for cases). The dendrogram above the heatmap is constructed using the Euclidian distances of the top 20 species and clustered using ward.D2 algorithm. Panel (C) compares the absolute resolve of ITS1 TV reads by clinical TV status with p-values being calculated using the t-test. Panel (D) shows the differential abundance analysis derived using ANCOM based on the TV case status.

