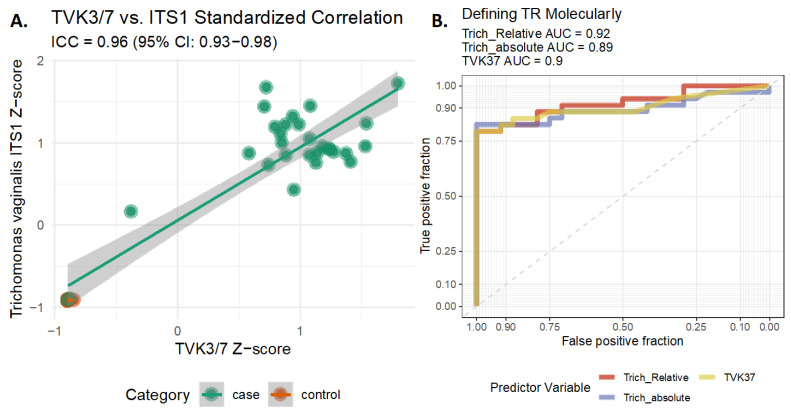
Figure 3.
ITS1 and TVK3/7 TV PCR Marker Gene Comparison. Panel (A) shows the scatter plot of the normalized NGS recovery of ITS1 TV reads compared to the TVK3/7 recovery. Consistency was calculated using two-way mixed effect intra-class correlation coefficient (ICC) on z-score standardized ITS1 TV NGS recovery and TVK3/7 recovery. Panel (B) shows the AUC analysis for the relative and absolute abundance of TV measured using ITS1, as well as the same analysis performed using the TVK3/7 NGS recovered reads. AUC for each metric is shown above the plot.

