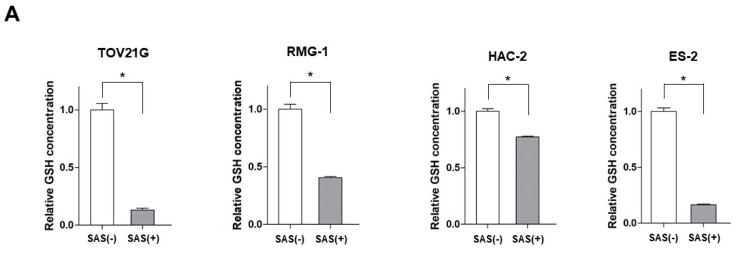
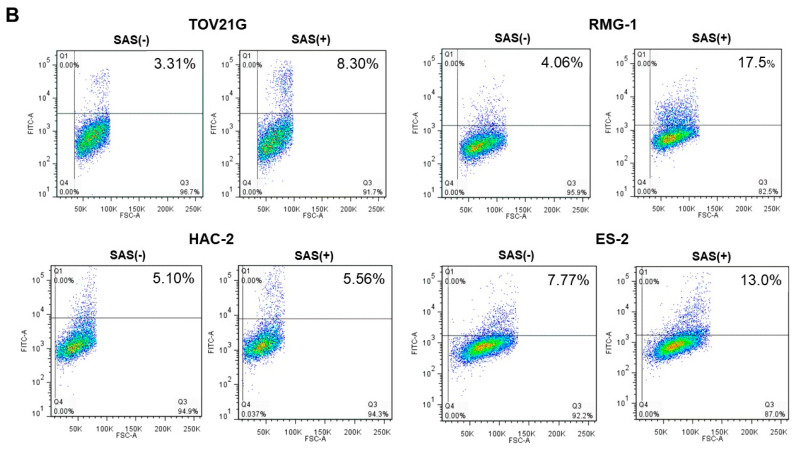
Figure 1.
The effect of SAS on the intracellular GSH levels and ROS accumulation in OCCC cell lines. (A) GSH levels were compared with or without 400 μM SAS treatment for 24 h in OCCC cells. GSH levels were calculated from the ratio of cells treated with drugs to that of untreated cells set as 1 (mean ± SD; n = 8). Data are presented as the mean ± standard deviation (SD). * p < 0.05 vs. un-treated cells. (B) OCCC cells were treated with 400 μM SAS for 24 h and the intracellular ROS levels were analyzed by means of flow cytometry after staining with DCFH-DA. GSH, glutathione; ROS, reactive oxygen species; SAS, sulfasalazine; DCFH-DA, 2′,7′-dichlorofluorescin diacetate. −, without; +, with.


