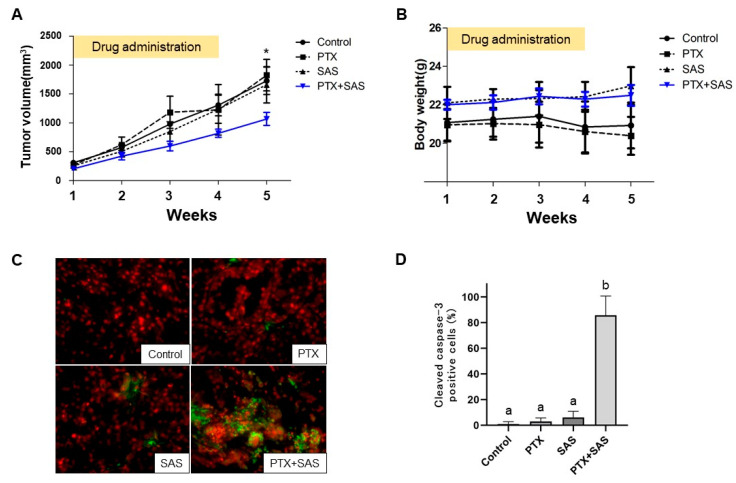
Figure 6.
PTX and SAS suppress xenograft tumor growth. (A) Time course and volume of tumors formed by RMG-1 cells in BALB/cAJcl-nu/nu mice treated with the individual drugs. RMG-1 cells were injected subcutaneously into the flanks of 6-week-old female BALB/cAJcl-nu/nu mice (n = 24), and the mice were randomly divided into four groups. In the subcutaneous model, once the tumor’s length reached 10 mm (n = 19, 5 mice developed no tumors), the mice were administrated with each of the drugs. One group of mice (n = 6) was treated with paclitaxel (20 mg/kg BW) 3 times weekly plus SAS (200 mg/kg BW) 5 times weekly for 4 weeks. A second group of mice (n = 4) was treated with paclitaxel alone (20 mg/kg BW) 3 times weekly for 4 weeks. The third group of mice (n = 5) was treated with SAS (200 mg/kg BW) 5 times weekly for 4 weeks. The remainder of the mice (n = 4) received the vehicle (DMSO + PBS) alone and were defined as the control. Values shown represent means ± SD. * p < 0.05 vs. mice with combination treatment of PTX and SAS. (B) Changes in weights of the mice with time. Values shown represent means ± SD. (C) Paraffin-embedded tissue sections were deparaffinized in xylene and double-stained with anti-cleaved caspase 3 followed by FITC-conjugated goat anti-rabbit IgG (green) and PI staining (red). Magnification × 400. (D) The number of cleaved caspase-3 positive cells was expressed as the percentage of total cells and shown for each tumor treated with DMSO + PBS (control), PTX and/or SAS. Values shown represent means ± SD. Different letters above the bars indicate a significant difference (p < 0.05, n = 4, in each group). SAS, sulfasalazine; PTX, paclitaxel.

