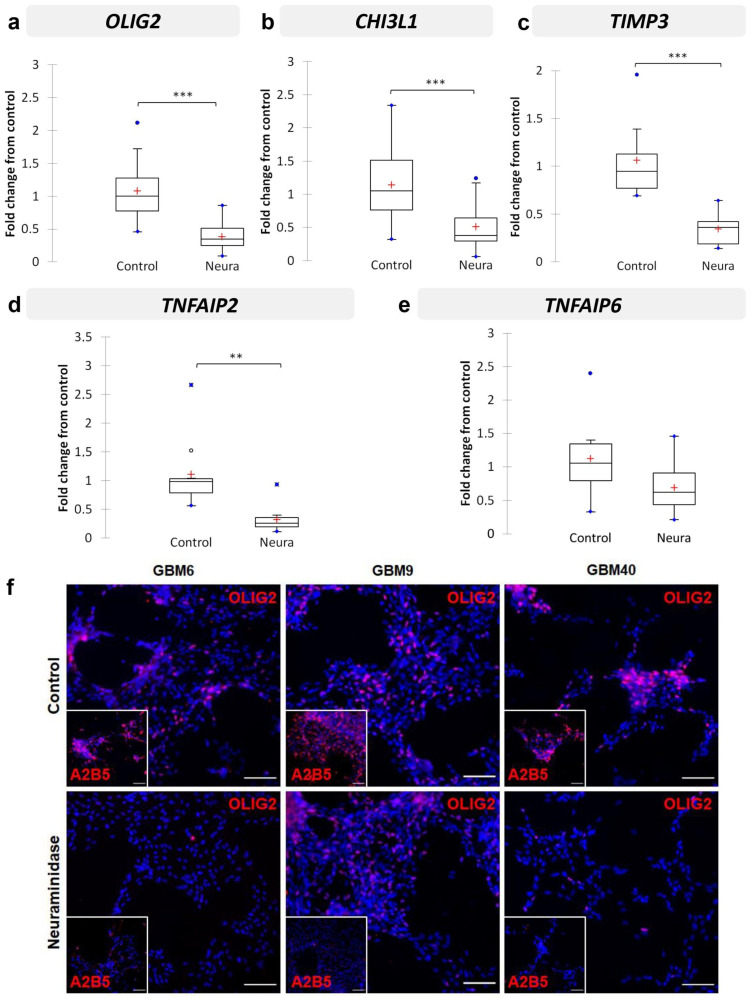
Figure 5.
Validation by RT-qPCR of selected genes in CSC (GBM6, GBM9, GBM40, with or without neuraminidase (Neura) administration): OLIG2 (a), CHI3L1 (b), TIMP3 (c), TNFAIP2 (d), and TNFAIP6 (e). Results are shown as fold change from control with box plots. The lower and upper edges of the box represent the first and third quartile respectively, while a horizontal line within the box indicates the median and the red cross the mean. The vertical length of the box represents the Interquartil range (IQR). The most extreme sample values (within a distance of 1.5 IQR from the median) are the endpoints of the lines extending from the box, while the black circles and the blue circles represent the outliers (1.5 IQR above 75th percentile) and far outliers (3 IQR above 75th percentile) respectively. Immunofluorescence detection of OLIG2 protein (f) in GBM6, GBM9 and GBM40 CSC lines in control cells (top panel) or after 24 h neuraminidase administration at EC50 (bottom panel). The small square shows the loss of A2B5 immunostaining after neuraminidase administration. Scale bar = 100 μm. *** p < 0.001, ** p < 0.01.

