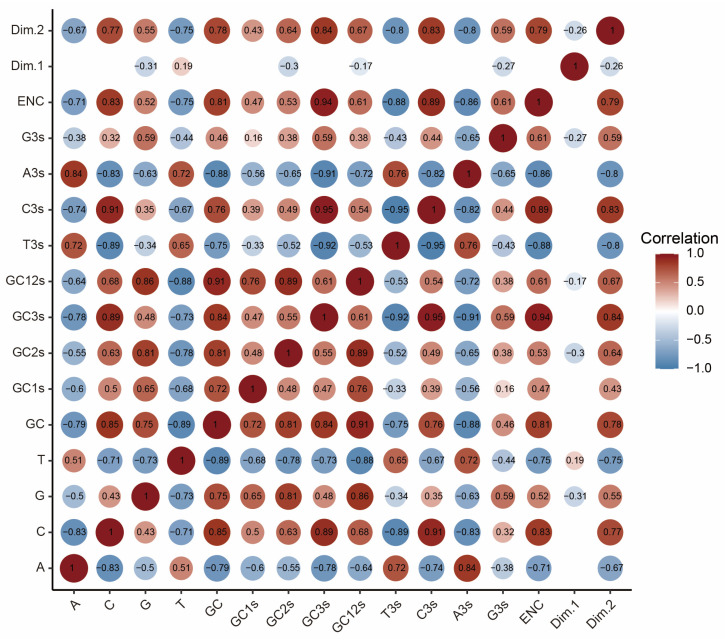
Figure 6.
Spearman’s correlation analysis of the nucleotide composition, ENC, and the first two principal components (Dim.1 and Dim.2) of the PCA for MPXV coding sequences. Dark red and blue indicate a positive and negative correlation, respectively. Deeper colors indicate a higher correlation. Only significant correlations are displayed (p < 0.05).

