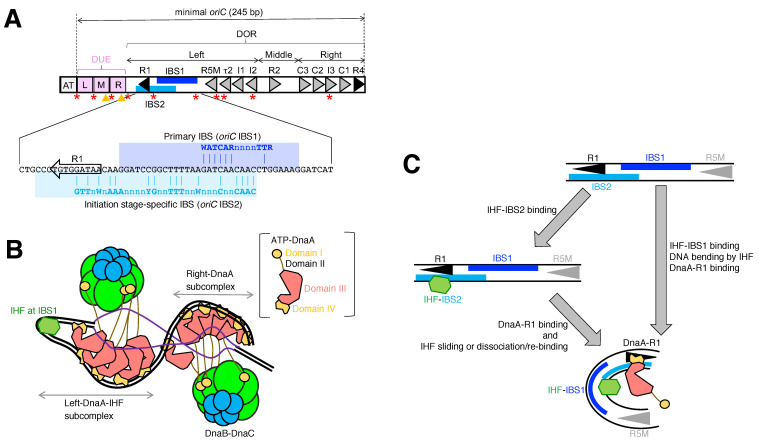
Figure 2.
(A) Detailed structure of oriC. Features of the oriC sequence are shown, including DnaA boxes (triangles), primary IBS (IBS1; blue bar), the DUE including the AT-rich 13 bp elements (pink squares), and the left/middle/right DORs. GATC sequences subject to Dam methylation are indicated as red stars. TT[A/G]T(T) motifs in L-, M-, and R-DUEs are shown as orange arrowheads. The sequence of the initiation stage-specific secondary IBS (IBS2; sky blue bar), which overlaps with the DnaA box R1, is shown. (B) Model of an unwound state of the initiation complex. Cartoons of DnaA domains I (orange), II (black line), III (red), and IV (brown) are schematically presented. IHF is shown as a light green hexagon. Head-to-tail subcomplexes of ATP-DnaA are formed on the left and right DORs and induce subsequent DnaB loading. (C) Model of DnaA box R1-mediated stabilization of oriC-IHF binding during the initiation period. First, IHF binds to either IBS1 or IBS2, and when ATP-DnaA occupies DnaA box R1, IHF can no longer bind to IBS2. In the initiation complex, IHF binding and bending at IBS1 are further stabilized by an ATP-DnaA oligomer.

