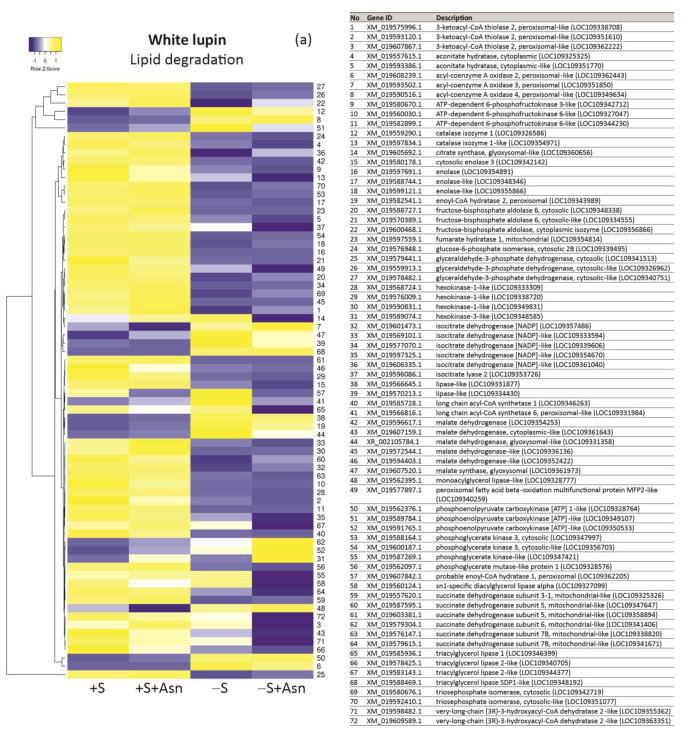
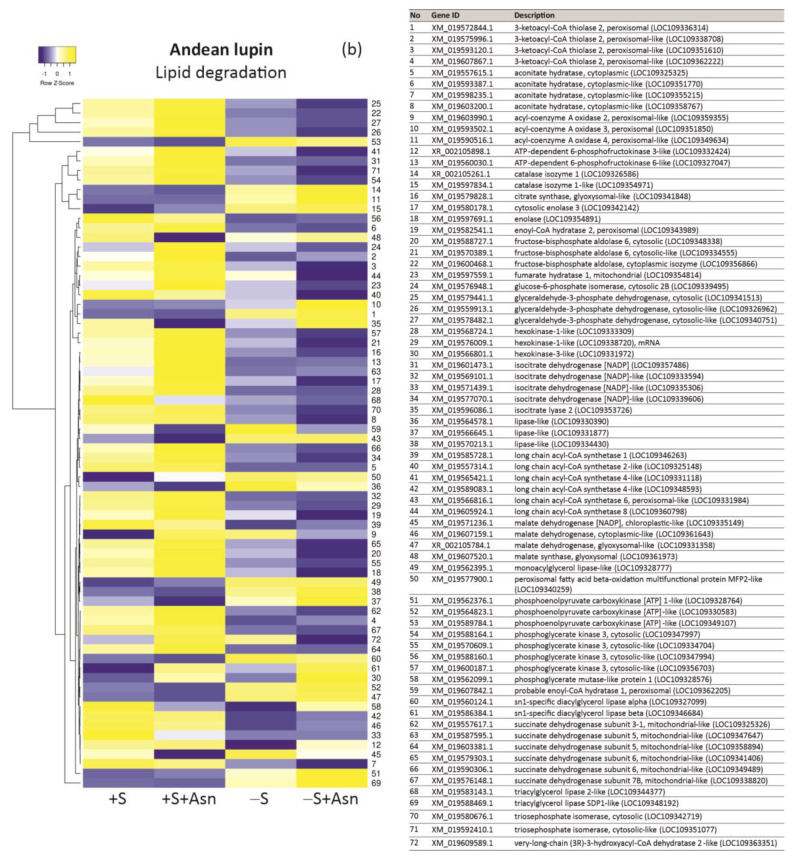
Figure 6.
Heatmaps showing relations in transcript levels of genes encoding proteins involved in lipid degradation in white lupin (a) and Andean lupin (b) isolated embryonic axes cultured in vitro for 96 h on a medium with (+S) and without (-S) 60 mM sucrose. Culture media were also enriched with 35 mM asparagine (+Asn). The data represent averages obtained from three independent experiments. The list of transcripts was made based on data from the literature [2,9,10,11] and the KEGG database dedicated to the narrow-leaved blue lupin (Lupinus angustifolius) genome (https://www.genome.jp/kegg-bin/show_organism?menu_type=pathway_maps&org=lang; accessed on 14 June 2022). The transcriptomics data selected for the preparation of this figure are presented in Table S3.


