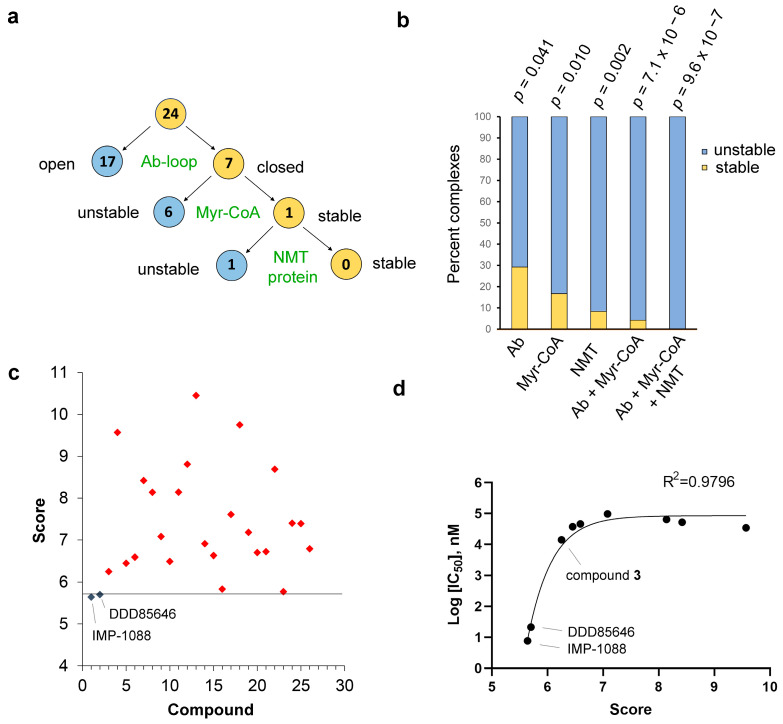
Figure 8.
Predicting NMT inhibitor potency based on MD simulations. (a) All 24 ligands with weak activity display instability of at least one of the depicted conformational elements compared to the control NMT inhibitors; (b) The percent complexes with increased RMSDs of the heavy atoms of the Ab-loop, Myr-CoA, the entire NMT protein, or either of them, compared to DDD85646 and IMP-1088, are shown in blue (unstable); the percent compound complexes with RMSDs of the indicated parameters lower than of the control NMT inhibitors are shown in orange (stable). These distributions are significantly related to the potency of the ligands (Chi-square test, p-values are shown on top of the bars); (c) The score—the sum of RMSD values of the Ab-loop, Myr-CoA, and the NMT protein for each of the ligand complexes, unambiguously identifies the potent NMT inhibitors DDD85646 and IMP-1088 (blue diamonds) (Chi-square test, p < 0.001); (d) The score is significantly inversely correlated with the potency of the compounds (logIC50) (nonlinear fit, R2 = 0.9796). All compounds with IC50 < 100 µM (compounds 1 to 9, Table 1) were used to create the graph. IMP-1088 and DDD85646 are correctly identified as the most potent and second-most potent compounds, respectively. Compound 3 is next in potency and is the best hit from the virtual screening with an IC50 = 14 µM (Table 1).

