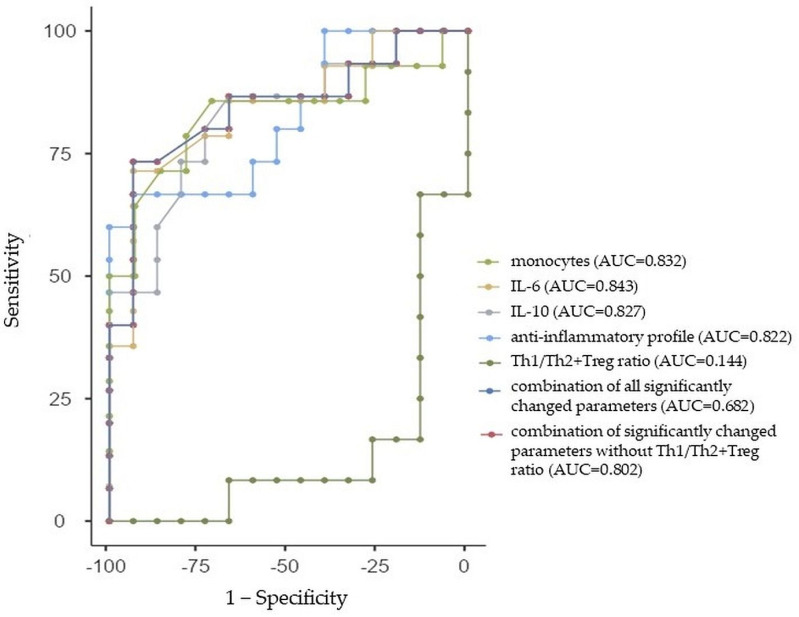
Figure 3.
Receiver-operating characteristic curve analysis for the prediction of autism spectrum disorder (ASD) in males using monocytes (Mon), interleukin (IL)-6 and IL-10, anti-inflammatory cytokine profile, Th1/Th2+Treg ratio, the combination of all significantly changed parameters, and the combination of significantly changed parameters without Th1/Th2+Treg ratio between ASD males and control males. AUC—area under the curve.

