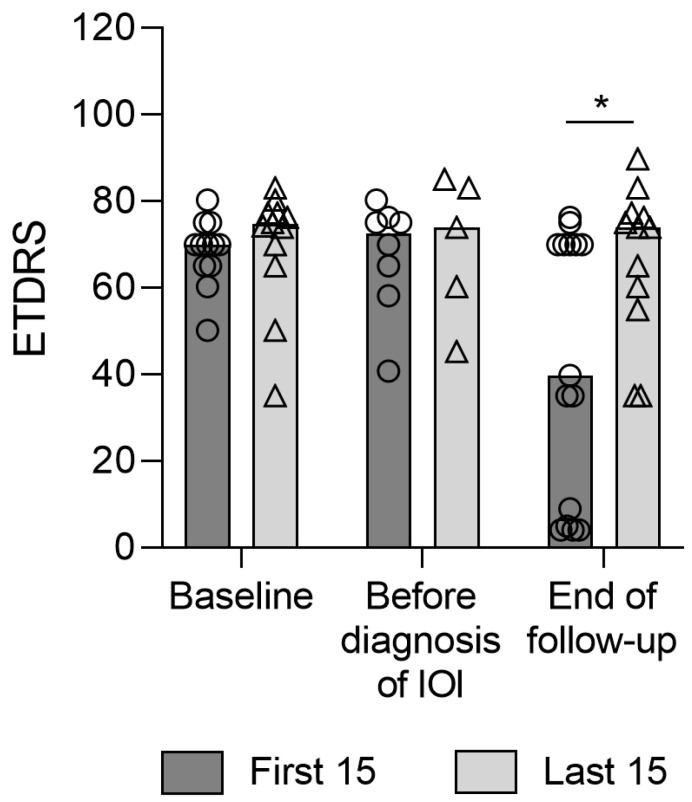
Figure 2.
Evolution of visual acuity in the first and last 15 reported eyes from baseline (beginning of brolucizumab treatment) until end of follow up. Circles: Datapoints for the first 15 reported eyes; Triangles: Datapoints for the last 15 reported eyes; *: significant difference between the first 15 and the last 15 (p = 0.03).

