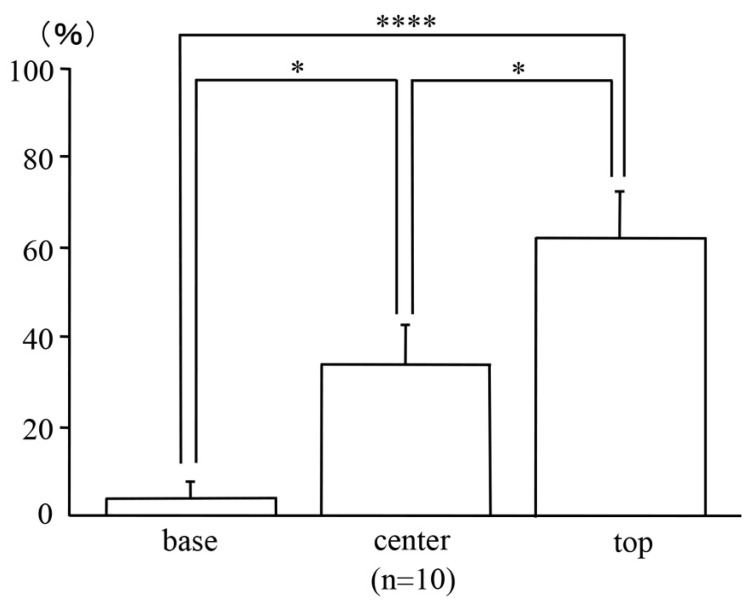
Figure 7.
Locations of the uni-cryptal neoplastic lesions in the AOM/DSS mice within the mucosae. Bars represent the percentage of locations of neoplastic cells at the base, center, and top of the mucosae, respectively. Data are expressed as the mean ± standard error of the mean of 10 uni-cryptal neoplastic lesions of the AOM/DSS mice. Results were compared using one-way analysis of variance followed by Fisher’s protected least significant difference test (* and **** represent p < 0.05 and p < 0.0001, respectively).

