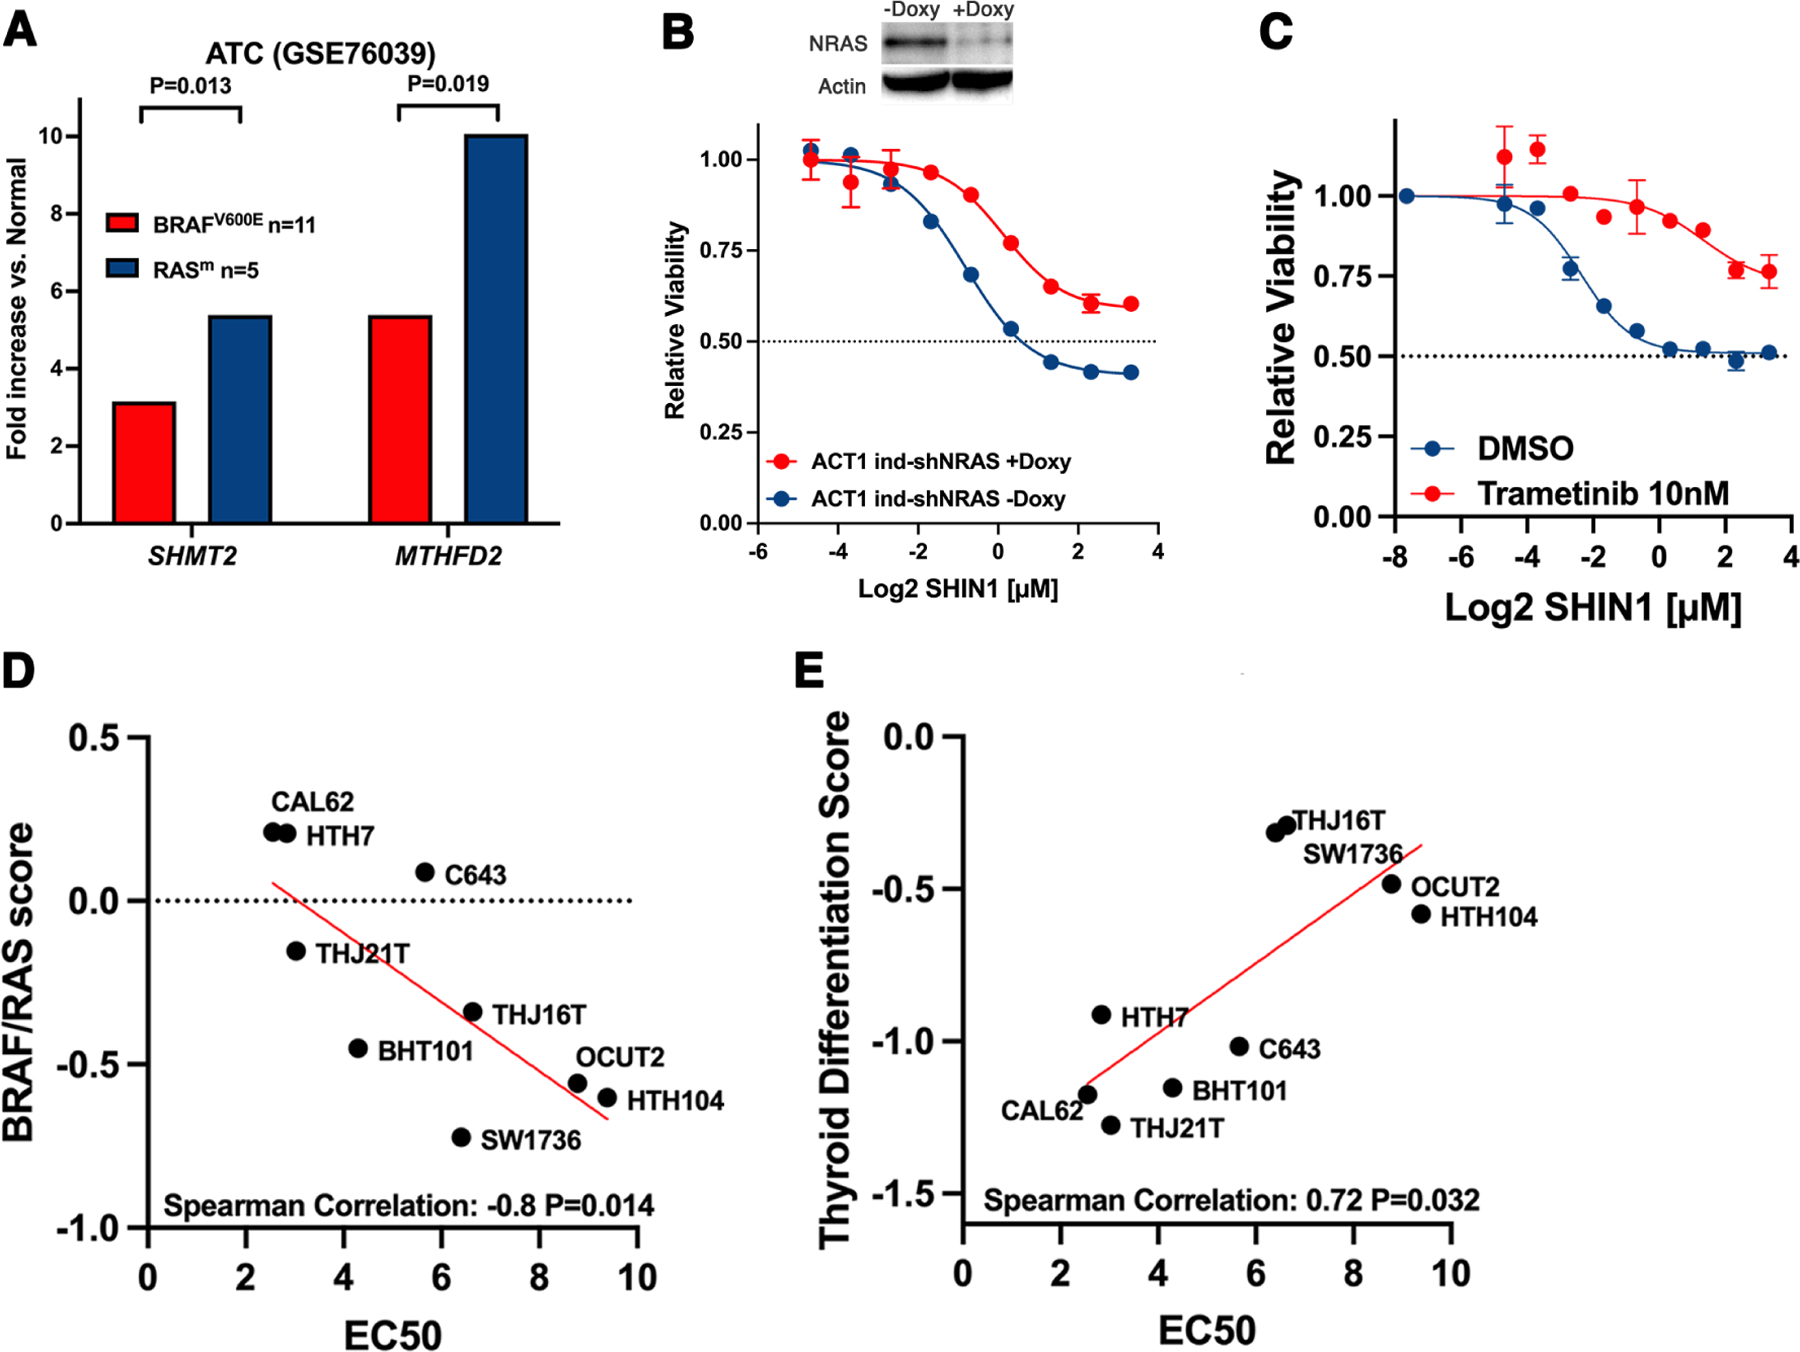
Figure 4. Correlations between one-carbon metabolism dependence, RAS mutation and differentiation status.

A) Average fold increase of SHMT2 and MTHFD2 expression in human ATCs according to driver mutation, using data from the indicated publicly available dataset. B) Effect of shRNA-mediated NRAS downregulation on the sensitivity to SHIN1 of the NRAS-mutant ACT1 cells. C) Effect of MEK inhibition on sensitivity to SHIN1 in ACT1 cells. D) Correlation between the BRAF/RAS score (higher value is more RAS-like) and sensitivity to SHIN1 in ATC cell lines. E) Correlation between the thyroid differentiation score (lower value is less differentiated) and sensitivity to SHIN1 in ATC cell lines.
