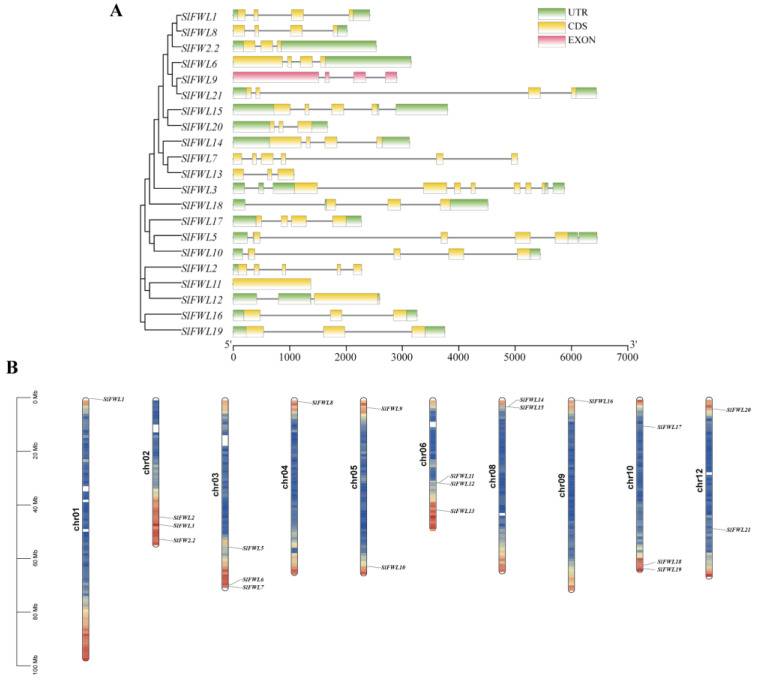
Figure 1.
Phylogenetic tree, gene structure, and chromosome distribution of SlFWLs. (A) Phylogenetic tree and gene structure analysis of the SlFWLs. Using the neighbor-joining (NJ) method with the bootstrap method’s default parameters set to 1000, the Poisson model on, and MEGA (Version 11). Numbers below the branches denote frequencies, whereas numbers surrounding the nodes denote branch lengths. UTR sequences and CDS are shown by green and yellow boxes, respectively. Non-protein-encoding exons are represented by pink boxes, and introns are represented by lines. (B) Chromosome distribution of SlFWL genes.

