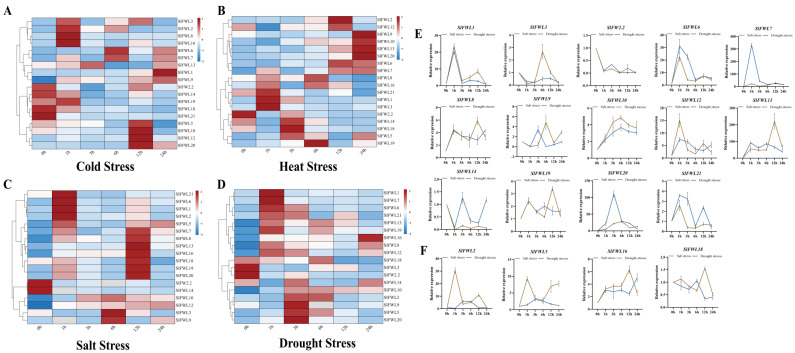
Figure 7.
qPCR analysis of SlFWL gene expression under abiotic stress treatments. (A) Cold stress; (B) Heat stress; (C) Salt stress (NaCl); (D) Drought stress (PEG6000); (E,F) The expression trends of SlFWL genes between drought stress and salt stress. The standard deviations are shown with error bars. Different letters indicate significant differences (p < 0.05).

