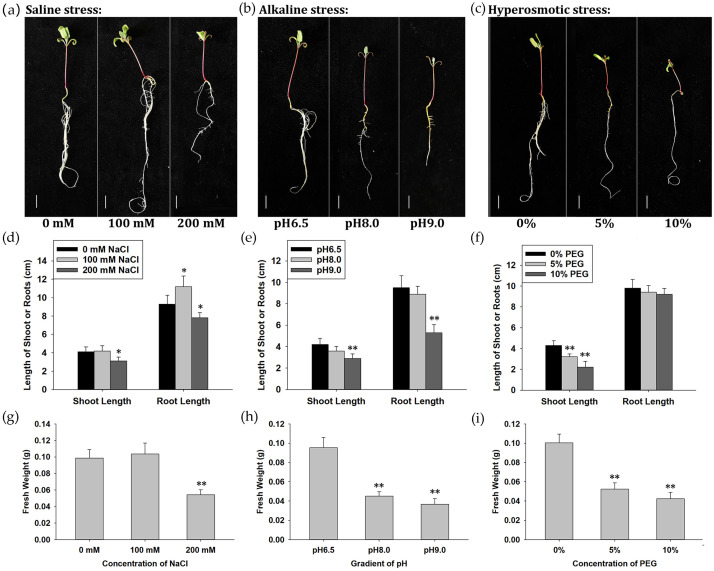
Figure 1.
Physiological response of quinoa strain CM499 to saline, alkaline and hyperosmotic stresses. (a–c) Growth phenotype of CM499 seedlings under saline, alkaline and hyperosmotic stresses, respectively. Scale bars are 1 cm. (d–f) Statistical analysis of shoot length and root length under saline, alkaline and hyperosmotic stresses, respectively. (g–i) Statistical analysis of fresh weight per plant under saline, alkaline and hyperosmotic stresses, respectively. The statistical difference between stress treatment groups and control group was analyzed using Student’s T-Test. * means p < 0.05 and ** means p < 0.01.

