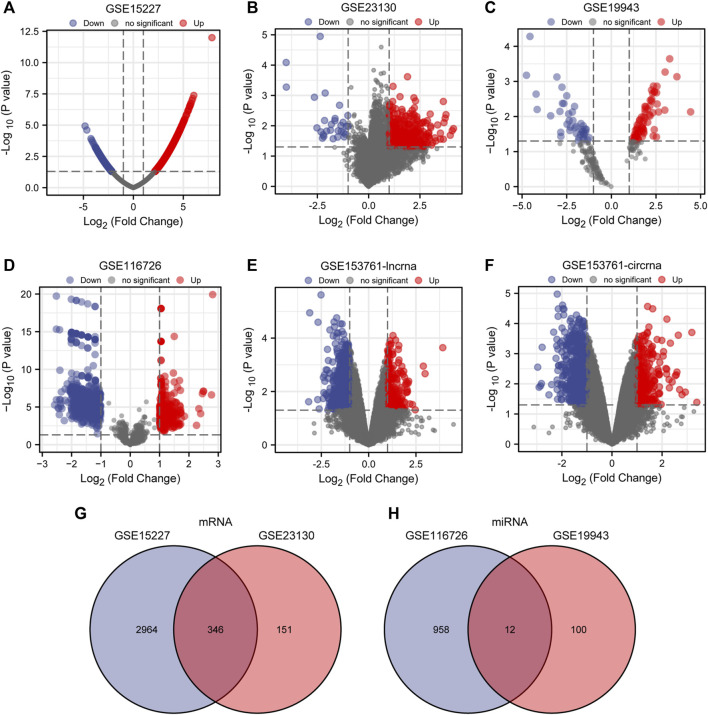
FIGURE 1.
Differential expression of mRNA, miRNA, lncRNA and cirRNA associated with IDD. (A–F) Volcano map of DE mRNAs, miRNAs, lncRNAs, and cirRNAs in GSE15227, GSE23130, GSE19943, GSE116726, and GSE153761 between IDD patients and healthy controls. Genes that have been upregulated are shown in red, those that have been downregulated in blue, and unaltered genes are represented in black. (G, H) DE miRNAs between GSE116726 and GSE19943 and DE mRNAs between GSE15227 and GSE23130 are shown in a Venn diagram.

