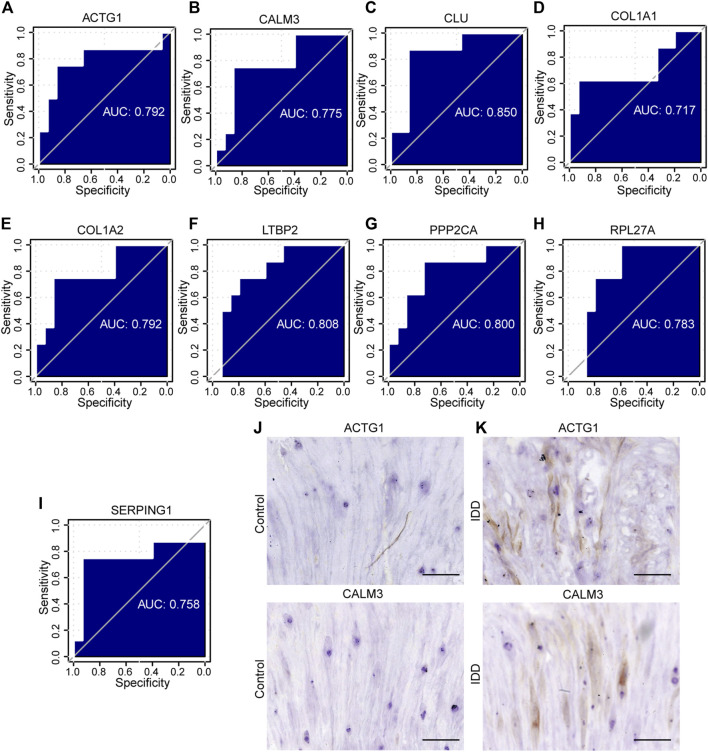
FIGURE 11.
The ROC curve analysis and immunohistochemistry. (A–I) The ROC curve of the hub genes in the GSE23130 dataset, the closer the AUC in the ROC curve was to 1, the better the diagnostic effect was. (J–K) The immunohistochemical (IHC) staining of ACTG1 and CALM3 both in IDD group and controls, bar = 100 μm. n = 3, ∗ p < 0.05, ∗∗p < 0.01, ∗∗∗p < 0.001. ROC represents receiver operating characteristic, AUC represents the area under the curve.

