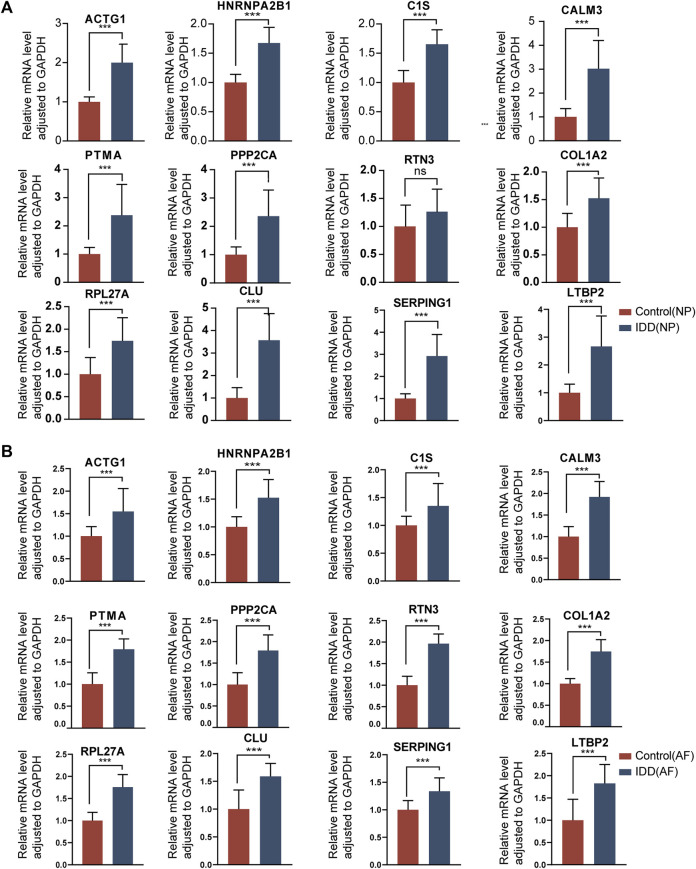
FIGURE 12.
The gene expression of hub genes in normal intervertebral disc tissues and IDD tissues. (A): Expression levels of mRNAs were compared between the two groups in NP tissues. (B): Expression levels of mRNAs were compared between the two groups in AF tissues. ∗ p < 0.05, ∗∗p < 0.01, ∗∗∗p < 0.001.

