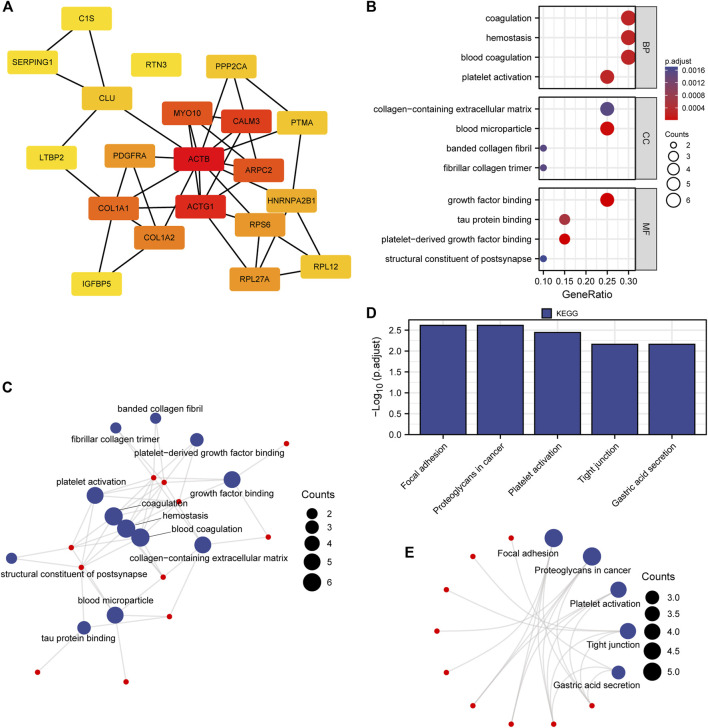
FIGURE 4.
PPI network, GO and KEGG enrichment analysis. (A) Nodes with red to yellow colors indicate genes with high to low PPI degree scores. (B, C) Hub gene GO enrichment analysis findings were shown in bubble and network diagrams. (D, E) Analysis of the 20 hub genes’ enriched KEGG pathways. BP represents a biological process, MF represents a molecular function and CC represents a cellular component.

