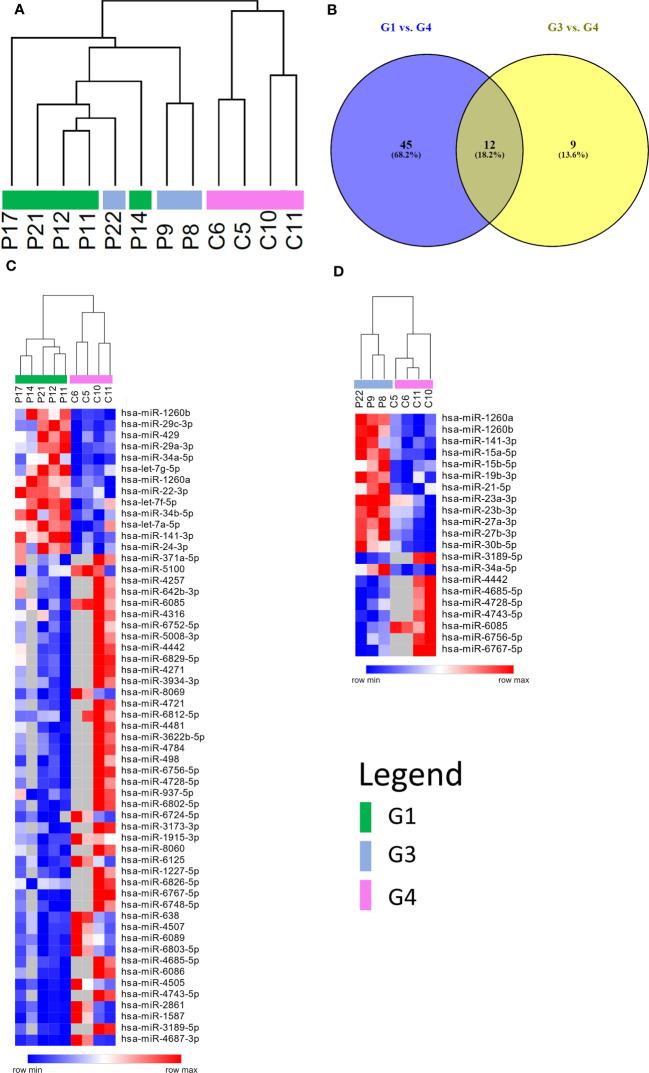
Figure 2.
miRNAs expression profiling. (A) Unsupervised hierarchical clustering analysis by using the 210 detected miRNAs. Patients are clearly separated from healthy controls, but not according to the severity of the olfactory symptoms. (B) Venn diagram of differentially expressed miRNAs resulting from the comparisons between persistent and no olfactory symptoms patients with respect to healthy controls. Most of differentially expressed miRNA are the same in both comparisons. Heatmap representing differentially expressed miRNAs of two different comparisons: persistent olfactory symptoms (C) and no olfactory symptoms (D) patients with respect to healthy controls. Most of miRNAs are under expressed after SARS-CoV-2 infection. A complete list of differentially expressed miRNAs is provided in the Supplementary Materials ( Supplementary Tables 2 , 3 ).

