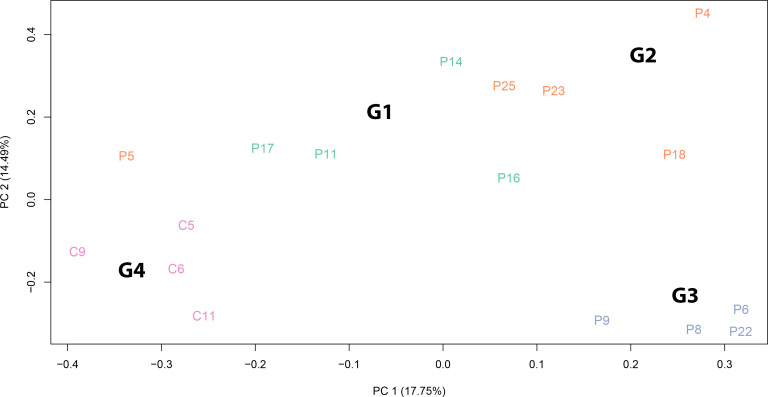
Figure 4.
Principal component analysis of normalized RNA-Seq read counts. The PCA shows the variance-stabilized gene expression dataset containing 13 SARS-CoV-2 patients and 4 healthy controls. Different colours indicate samples belonging to different groups: patients with persistent olfactory symptoms (Group 1, green), patients with full recovery of olfactory perception (Group 2, orange), patient with no olfactory symptoms (Group 3, light blue) and healthy controls (Group 4, pink). The PCA was able to separate samples according to SARS-CoV-2 infection and to different olfactory symptoms. The explained variance (%) for PC1 and PC2 are also given.

