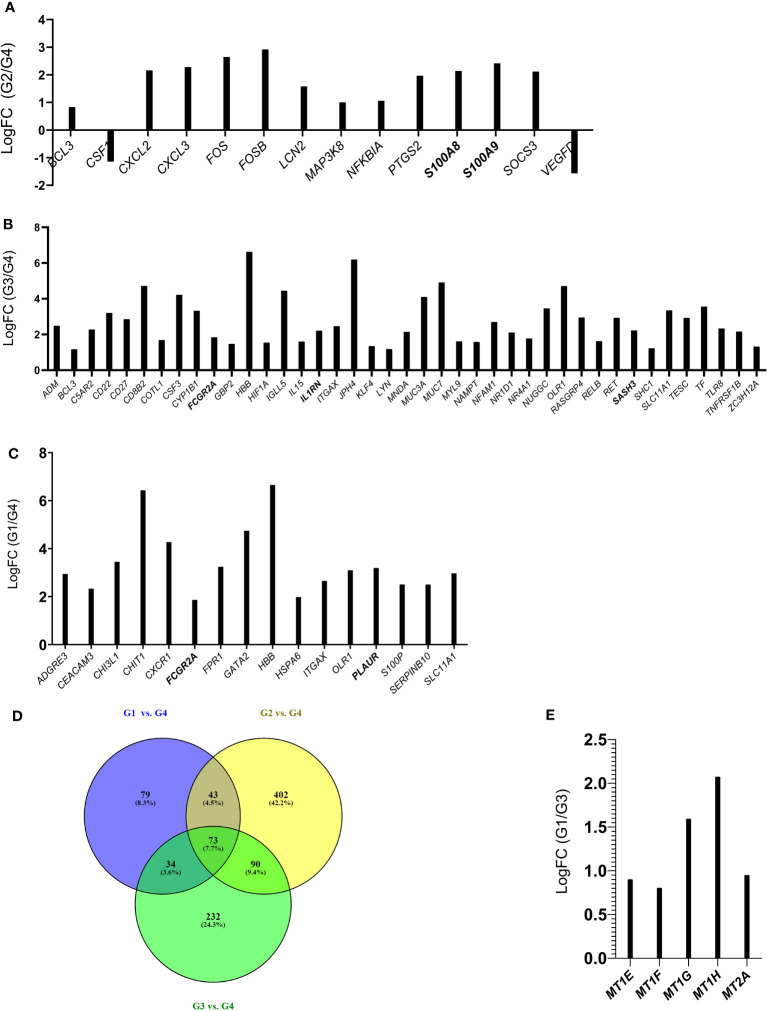
Figure 5.
Histograms of DEGs belonging to the IL-17 and TNF pathway (Group 2 vs. Group 4) (A); Biological Processes related to immune activities (Group 3 vs. Group 4) (B) and to neutrophils and granulocytes (Group 1 vs. Group 4) (C). Common DEGs between G1 vs. G4, G2 vs. G4, G3 vs. G4 comparisons are represented in the Venn Diagram (D), Histograms of DEGs belonging to the Biological Process of detoxification of inorganic compound (Group 1 vs. Group 3) (E). In bold are indicated the genes that were validated by qRT-PCR ( Supplementary Figure 7 ).

