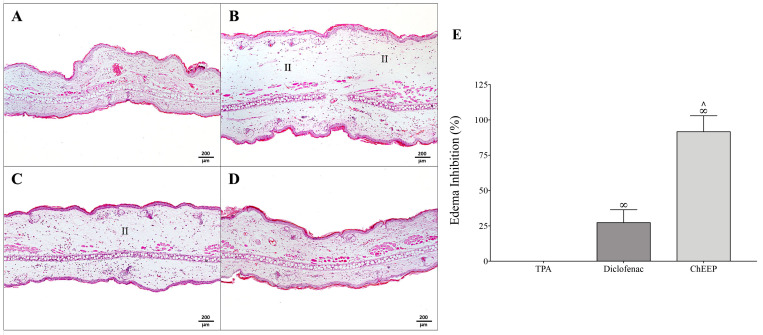
Figure 4.
Anti-inflammatory activity of ChEEP. Photomicrographs of mouse ears from the TPA-induced test groups are shown as control (without treatment) (A), TPA (B), TPA + diclofenac (C), and TPA + ChEEP (D). Percentage of edema inhibition compared with the control group (left ear-untreated) (E). Significant differences were determined by ANOVA. ∞ indicates significant differences with TPA and ∧ with diclofenac. Inflammatory infiltrate (II). Hematoxylin-eosin staining.

