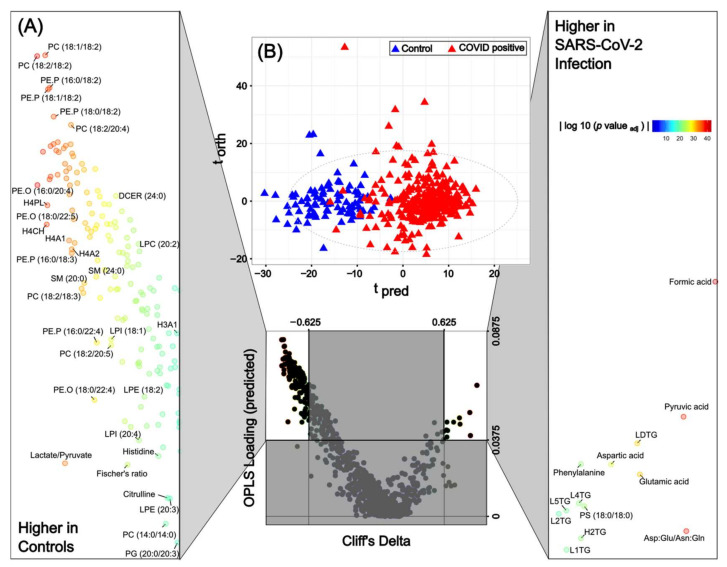
Figure 1.
The integrative pan-metabolic model compares the controls and SARS-CoV-2 positive patients. (A) Eruption plot of the controls vs. SARS-CoV-2 positive patients for the combined model. (B) O-PLS-DA of the control samples (blue triangles) and SARS-CoV-2 positive patients (red triangles) for all four integrated assays, R2X = 0.13, AUROC = 0.99. p-values for all metabolites/lipids/lipoproteins can be found in Table S5.

