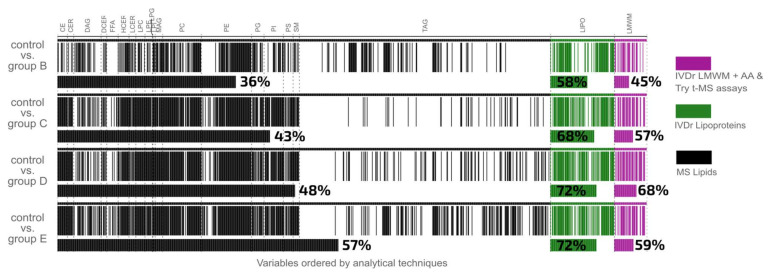
Figure 2.
Metabolic Barcode Diagram illustrating the Pan-Metabolic statistically significant lipids, lipoproteins, low molecular weight metabolites, amino acids, and tryptophan pathway intermediates for each respiratory severity group versus the controls. The 1034 quantitative variables are ordered by analytical technique, lipids (black), lipoproteins (green), and low molecular weight metabolites and MS amino acids and tryptophan (magenta). White spaces on the plot indicate metabolites that are not significant.

