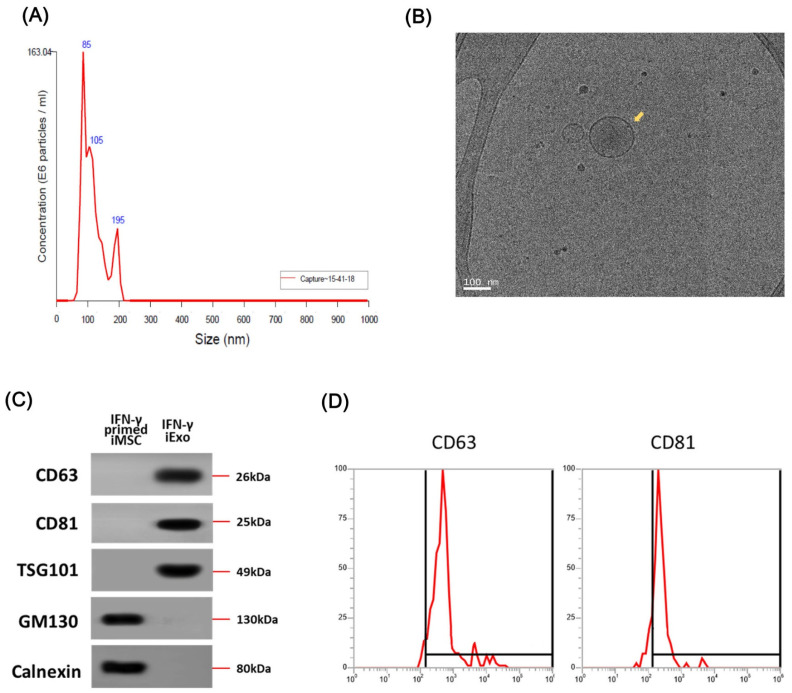
Figure 2.
Characterization of exosomes produced from IFN-γ primed iMSCs (IFN-γ-iExo). (A) Size measurement of IFN-γ-iExo using nanoparticle tracking analysis (NTA). (B) Cryo-transmission electron microscopy (cryo-TEM) images of IFN-γ-iExo showing lipid bilayers and vesicular internal structures. (C) Immunoblotting analysis for exosome-related markers (CD63, CD81, and TSG101) and cell-specific markers (GM130 and Calnexin) in IFN-γ-iExo and their parental IFN-γ-primed iMSCs. (D) Flow cytometry analysis of CD63 and CD81 in IFN-γ-iExo. Y-axis represents the maximum percentage (%).

