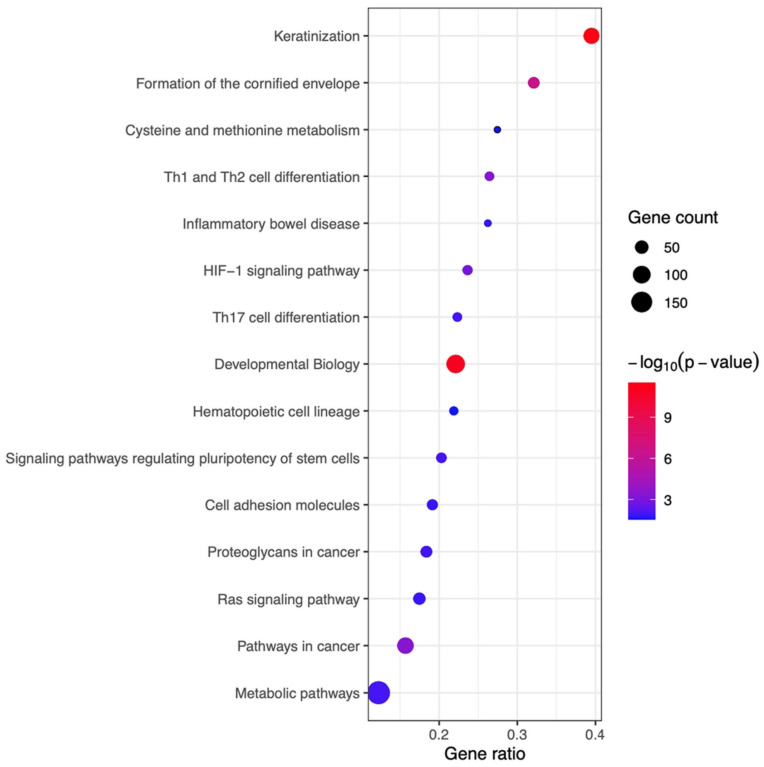
Figure 6.
The Kyoto Encyclopedia of Genes and Genomes (KEGG) pathway enrichment analysis of differentially expressed genes (DEGs) in skin tissues obtained from AD mice treated with IFN-γ-iExo and those treated with PBS. Pathways with significantly enriched genes are shown in descending order of the gene ratio. The gene ratio refers to the ratio of DEGs in each pathway. The absolute number of DEGs in each pathway is represented by the size and the significance of the color of the dots. The color codes are shown in -log10 (p-value) form.

