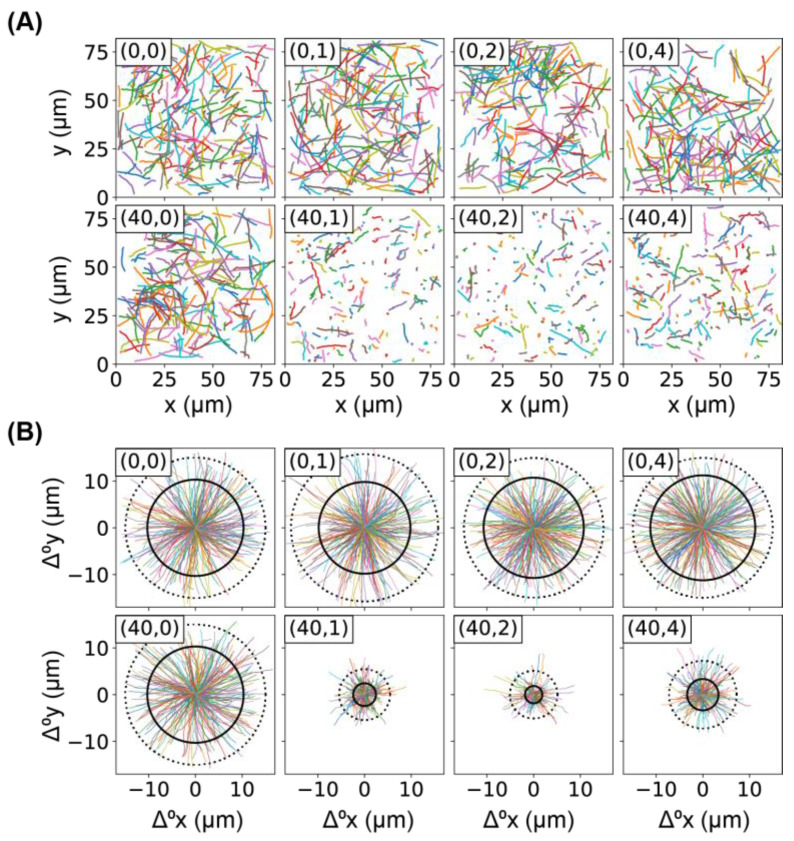
Figure 1.
Motion of bacteria in the absence and presence of Ag+ ions. (A) Trajectories of bacteria, untreated or treated by Ag+ ions at 40 µM. Each sub-figure contains 200 randomly chosen trajectories and is labeled by (cAg, Ttr), where cAg is the concentration of Ag+ ions and Ttr is the treatment/incubation time. (B) Rose graphs of the first 12 frames of trajectories of bacteria, untreated or treated by Ag+ ions at 40 µM. Each sub-figure is labeled similarly as in (panel A). Under each condition, 300 randomly chosen examples of the trajectories were shown in color, while the mean and 90th percentile of the displacements of the first 12 frames of all the trajectories were shown as solid and dotted circles, respectively.

