Figure 3.
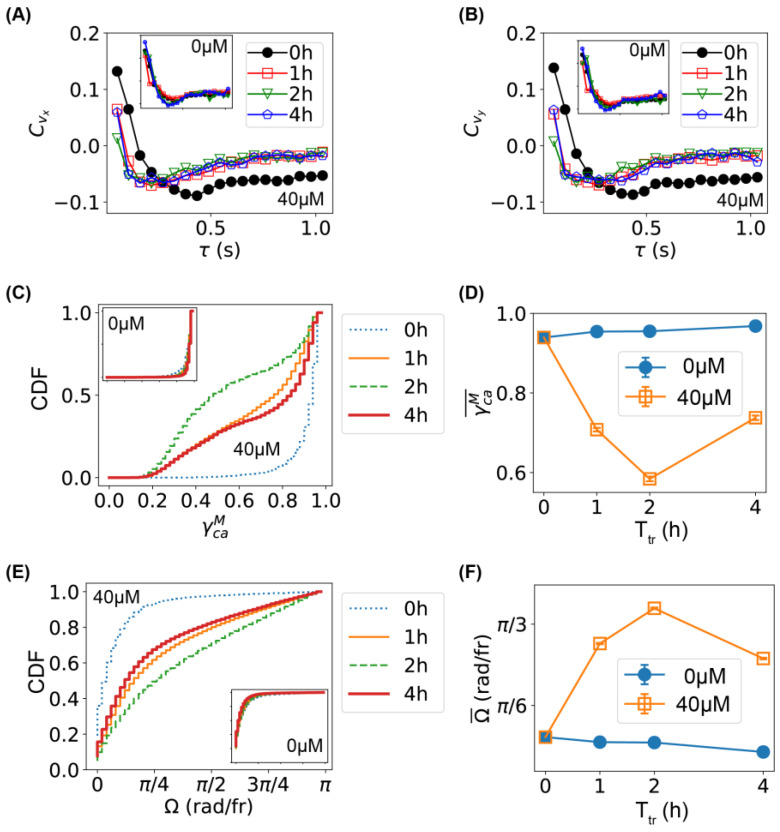
Characterization of bacterial movement and comparison between untreated and treated bacteria. (A,B) Autocorrelation of velocities (A: vx; B: vy) for bacteria treated with Ag+ ions at 40 µM for 0, 1, 2, and 4 h. Insets: the corresponding results for untreated bacteria. (C) Cumulative distribution function (C,D,F) of the maximum chord-to-arc ratio () for the trajectories of bacteria untreated (0 h) or treated with 40 M Ag+ ions for 1, 2, and 4 h. (D) Dependence of the mean of on treatment time. (E) CDF of the changing rate of swimming directions () for bacteria untreated (0 h) or treated with 40 M Ag+ ions for 1, 2, and 4 h. (F) Dependence of the mean of on treatment time.

