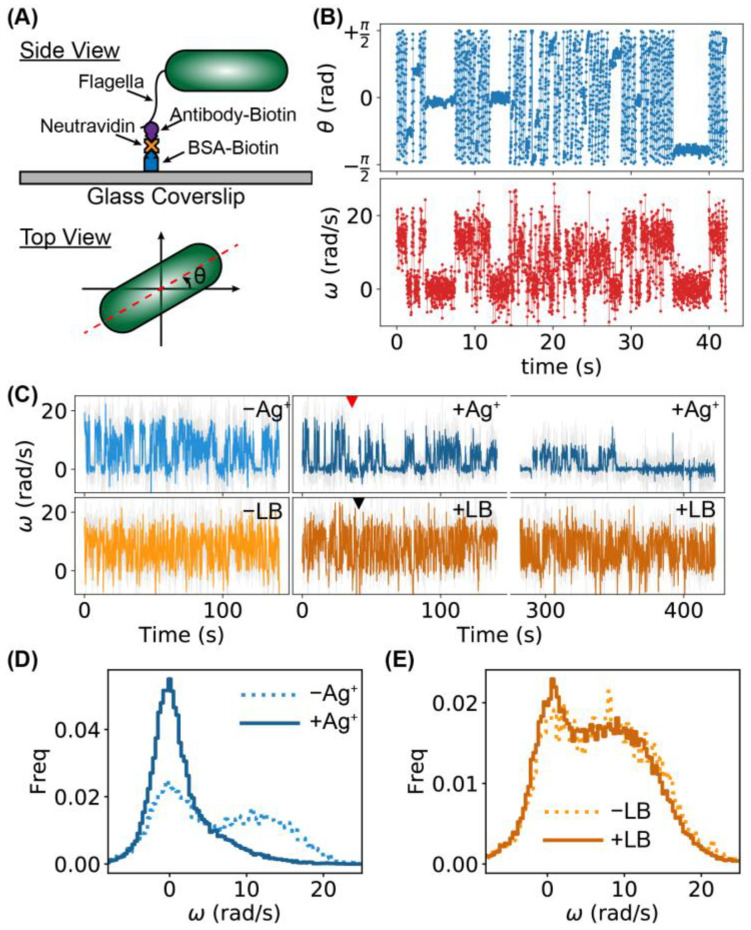
Figure 4.
Tethering assay for investigating the running and tumbling/pausing of individual bacteria. (A) Tethering of a bacterium on a glass coverslip (side view) and orientation of a bacterium (top view). (B) Examples of trajectories of orientation and angular velocity of a bacterium for 3000 frames (or 42.3 s). (C) Examples of -trajectories for two bacteria. The top one was treated (blue curves) with Ag+ ions; the red arrow indicates the time of adding Ag+ ions. The bottom trajectories (orange curves) were for a bacterium without treatment. LB medium was added into the sample at the time indicated by the black arrow. (D) Distributions of for a bacterium treated by Ag+ ions: pre-Ag+ (dotted) and post-Ag+ (solid). (E) Distributions of for an untreated bacterium: pre-LB (dotted) and post-LB (solid).

